Python数据分析三剑客
1、Numpy
1.1 什么是numpy
- numpy是Python中科学计算的基础包。它是一个Python库,提供多维数组对象、各种派生对象(例如掩码数组和矩阵)以及用于对数组进行快速操作的各种方法,包括数学、逻辑、形状操作、排序、选择、I/O 、离散傅里叶变换、基本线性代数、基本统计运算、随机模拟等等。
- numpy的部分功能如下:
- ndarray,一个具有矢量算术运算和复杂广播能力的快速且节省空间的多维数组。
- 用于对整组数据进行快速运算的标准数学函数(无需编写循环)。
- 用于读写磁盘数据的工具以及用于操作内存映射文件的工具。
- 线性代数、随机数生成以及傅里叶变换功能。
- 用于集成由C、C++、Fortran等语言编写的代码的API。
1.2 ndarray的限制
- 大多数numpy数组都有一些限制:
- 数组的所有元素必须具有相同的数据类型。
- 一旦创建,数组的总大小就不能改变。
- 形状必须是“矩形”,而不是“锯齿状”。例如二维数组的每一行必须具有相同的列数。
1.3 ndarray的属性
1 | import numpy as np # 导入numpy |
1.4 ndarray的创建方式
1.4.1 array()与asarray()
**array()**:将输入数据转换为ndarray,会进行copy。
**asarray()**:将输入数据转换为ndarray,如果输入本身是ndarray则不会进行copy。
1
2
3
4
5
6
7
8
9
10
11
12
13
14
15
16
17
18
19
20
21
22# 数组的创建方式
"""
array:将输入的数据转换为ndarray,会进行copy
asarray:将输入的数据转换为ndarray,如果输入本身是ndarray,则不会进行copy
"""
import numpy as np
data = [1,2,3]
print(f"元数据地址为:{id(data)}") # 数据地址为:4374745152
arr = np.array(data)
print(f"arr1地址为:{id(arr)}") # arr1地址为:4385793360
print(f"数组数据为:{arr}") # 数组数据为:[1 2 3]
print("-" * 20)
arr2 = np.array(arr)
print(f"arr2地址为:{id(arr2)}") # arr2地址为:4406154160
print(f"arr2数组数据为:{arr2}") # arr2数组数据为:[1 2 3]
print("-" * 20)
arr3 = np.asarray(arr)
print(f"arr3地址为:{id(arr3)}") # arr3地址为:4385793360
print(f"arr3数组数据为:{arr3}") # arr3数组数据为:[1 2 3]
1.4.2 zeros()、ones()、empty()与zeros_like()、ones_like()、empty_like()
**zeros()**:返回给定形状和类型的新数组,用0填充。
**ones()**:返回给定形状和类型的新数组,用1填充。
**empty()**:返回给定形状和类型的未初始化的新数组。
- 需要注意的是,np.empty 并不保证数组元素被初始化为 0,它只是分配内存空间,数组中的元素值是未初始化的,可能是内存中的任意值。
- 上述3个方法创建的数组元素类型默认都是float64。
**zeros_like()**:返回与给定数组具有相同形状和类型的0新数组。
**ones_like()**:返回与给定数组具有相同形状和类型的1新数组。
**empty_like()**:返回与给定数组具有相同形状和类型的未初始化的新数组。
1
2
3
4
5
6
7
8
9
10
11
12
13
14
15
16
17import numpy as np
arr1 = np.zeros((2, 5)) # 创建全0数组
# [[0. 0. 0. 0. 0.]
# [0. 0. 0. 0. 0.]]
arr2 = np.ones_like(arr1) # 创建和arr1形状相同的全1数组
# [[1. 1. 1. 1. 1.]
# [1. 1. 1. 1. 1.]]
arr3 = np.empty((2, 3)) # 创建未初始化的数组
# [[-9.05243306e-312 -1.06658093e-264 9.05246807e-312]
# [ 9.05246807e-312 6.91691904e-323 2.96439388e-323]]
arr4 = np.empty_like(arr3) # 创建和arr3形状相同的未初始化数组
# [[-6.95272242e-310 1.22635717e+139 9.05246806e-312]
# [ 9.05246806e-312 1.33397724e-322 4.15015143e-322]]- 注意:这里元素间的分隔符是空格,而不是小数点。
1.4.3 full()与full_like()
**full()**:返回给定形状和类型的新数组,用指定的值填充。
**full_like()**:返回与给定数组具有相同形状和类型的用指定值填充的新数组。
1
2
3
4
5
6
7arr1 = np.full((2, 3), 6)
# [[6 6 6]
# [6 6 6]]
arr2 = np.full_like(arr1, 5)
# [[5 5 5]
# [5 5 5]]
1.4.4 arange()
**arange()**:返回在给定范围内用均匀间隔的值填充的一维数组。
1
2arr1 = np.arange(0, 10, 2)
# [0 2 4 6 8]
1.4.5 linspace()与logspace()
**linspace()**:返回指定范围和元素个数的等差数列。数组元素类型为浮点型。
**logspace()**:返回指定指数范围、元素个数、底数的等比数列。
1
2
3
4
5
6
7
8arr1 = np.linspace(start=0, stop=10, num=5)
# [ 0. 2.5 5. 7.5 10. ]
arr2 = np.linspace(start=0, stop=10, num=5, endpoint=False) # 设置endpoint=False,表示不包括stop
# [0. 2. 4. 6. 8.]
arr3 = np.logspace(start=2, stop=5, num=5, base=2)
# [ 4. 6.72717132 11.3137085 19.02731384 32.- 默认endpoint=True时:如果把0到10看作一条线段,相当于用5个点将这条线段分成了4段,要计算每段的长度(即相邻元素的间隔),用总长度 (stop - start) 除以段数 (num - 1) ,得到间隔为 10-0 / 4 = 2.5。这样从起始点 0 开始,每次加上间隔 2.5 就能依次得到序列中的元素:0、2.5、5、7.5、10 。
- 若endpoint=False的情况:意味着 stop 这个值不包含在生成的序列中,此时 [start, stop) 区间相当于一条右端点空心(不包含 stop 这个点)的线段。我们在这条线段上放置 num 个点进行划分,每一个点都会划分出一个新的区间段。比如,放 1 个点会把线段分成 1 段,放 2 个点会分成 2 段,放 num 个点就会分成 num 段,段数就等于点数 num,计算间隔的公式就变为 (stop - start) / num 。
1.4.6 创建随机数数组
**random.rand()**:返回给定形状的数组,用 [0, 1) 上均匀分布的随机样本填充。
**random.randint()**:返回给定形状的数组,用从低位(包含)到高位(不包含)上均匀分布的随机整数填充。
**random.uniform()**:返回给定形状的数组,用从低位(包含)到高位(不包含)上均匀分布的随机浮点数填充。
**random.randn()**:返回给定形状的数组,用标准正态分布(均值为0,标准差为1)的随机样本填充。
1
2
3
4
5
6
7
8
9
10
11
12
13
14
15arr1 = np.random.rand(2, 3)
# [[0.77112868 0.97415392 0.25668864]
# [0.49946961 0.23491874 0.40514576]]
arr2 = np.random.randint(0, 10, (2, 3))
# [[7 8 2]
# [1 2 3]]
arr3 = np.random.uniform(3, 6, (2, 3))
# [[5.69275495 3.84857937 3.2899215 ]
# [5.32035519 3.7460973 3.33859905]]
arr4 = np.random.randn(2, 3)
# [[-2.03654925 -0.50146561 0.4362483 ]
# [-1.90585739 0.94797017 -0.77026926]]
1.4.7 matrix()
matrix为ndarray的子类,只能生成二维的矩阵。
1
2
3
4
5
6
7arr1 = np.matrix("1 2; 3 4")
# [[1 2]
# [3 4]]
arr2 = np.matrix([[1, 2], [3, 4]])
# [[1 2]
# [3 4]]
1.5 ndarray的数据类型
| 数据类型 | 类型代码 | 说明 |
|---|---|---|
| bool | ? | 布尔类型 |
| int8、uint8、int16、uint16、int32、uint32、int64、uint64 | i1、u1、i2、u2、i4、u4、i8、u8 | 有符号、无符号的8位(1字节)整型;有符号、无符号的16位(2字节)整型、有符号、无符号的32位(4字节)整型;有符号、无符号的64位(8字节)整型 |
| float16float32、float64 | f2、f4或f、f8或d | 半精度浮点型、单精度浮点型、双精度浮点型 |
| complex64、complex128 | c8、c16 | 用两个32位浮点数表示的复数 用两个64位浮点数表示的复数 |
创建数组时可以使用dtype参数指定元素类型:
1
2
3
4
5arr1 = np.array([1, 2, 3], dtype=np.float64)
# [1. 2. 3.]
arr2 = np.array([0.2, 2.5, 4.8], dtype="i8")
# [0 2 4]也可以使用ndarray.astype()方法转换数组的元素类型:
1
2
3
4
5arr1 = np.array([1, 2, 3], dtype=np.float64)
# [1. 2. 3.]
arr2 = arr1.astype(np.int64)
# [1 2 3]
1.6 ndarray切片和索引
ndarray对象的内容可以通过索引或切片来访问和修改,与 Python 中 list 的切片操作一样。
可以通过内置的slice函数,或者冒号设置start, stop及step参数进行切片,从原数组中切割出一个新数组。
1
2
3
4
5
6
7
8
9
10
11
12
13
14
15
16
17
18
19
20
21
22
23
24
25import numpy as np
arr = np.arange(10)
print(arr)
# [0 1 2 3 4 5 6 7 8 9]
#获取索引为2的数据
print(arr[2])
# 2
# 从索引 2开始到索引9(不包含)停止,间隔为2
print(arr[slice(2,9,2)])
# [2 4 6 8]
# 从索引2开始到索引9(不包含)停止,间隔为2
print(arr[2:9:2])
# [2 4 6 8]
# 从索引2开始到最后(不包含),默认间隔为1
print(arr[2:])
# [2 3 4 5 6 7 8 9]
# 从索引2开始到索引9(不包含)结束,默认间隔为1
print(arr[2:9])
# [2 3 4 5 6 7 8]
1.7 numpy常用函数
1.7.1 基本函数
| 函数 | 说明 |
|---|---|
| np.abs() | 元素的绝对值,参数是 number 或 array |
| np.ceil() | 向上取整,参数是 number 或 array |
| np.floor() | 向下取整,参数是 number 或 array |
| np.rint() | 四舍五入,参数是 number 或 array |
| np.isnan() | 判断元素是否为NaN(Not a Number) ,参数是 number 或 array |
| np.multiply() | 元素相乘,参数是 number 或 array。如果第二个参数传递的是number,原数组中所有元素乘以这个数字,返回新的数组;如果第二个参数也是一个数组,是将两个数组中对应位置的元素相乘,返回一个新的数组,其形状与输入数组相同。 |
| np.divide() | 元素相除,参数是 number 或 array |
| np.where(condition, x, y) | 三元运算符,x if condition else y |
1 | import numpy as np |
1.7.2 统计函数
| 函数 | 说明 |
|---|---|
| np.mean() | 所有元素的平均值 |
| np.sum() | 所有元素的和 |
| np.max() | 所有元素的最大值 |
| np.min() | 所有元素的最小值 |
| np.std() | 所有元素的标准差 |
| np.var() | 所有元素的方差 |
| np.argmax() | 最大值的下标索引值 |
| np.argmin() | 最小值的下标索引值 |
| np.cumsum() | 返回一个一维数组,每个元素都是之前所有元素的累加和 |
| np.cumprod() | 返回一个一维数组,每个元素都是之前所有元素的累乘积 |
多维数组在计算时默认计算全部维度,可以使用axis参数指定按某一维度为轴心统计,axis=0按列统计、axis=1按行统计。
1
2
3
4
5
6
7
8
9
10
11
12
13
14
15
16
17
18
19
20import numpy as np
arr1 = np.random.randint(1, 5, (2, 3))
print(arr1)
# [[1 1 4]
# [3 2 2]]
print(np.mean(arr1)) # 2.1666666666666665
print(np.sum(arr1)) # 13
print(np.max(arr1)) # 4
print(np.min(arr1)) # 1
print(np.std(arr1)) # 1.0671873729054748
print(np.var(arr1)) # 1.1388888888888888
print(np.argmax(arr1)) # 2
print(np.argmin(arr1)) # 0
print(np.cumsum(arr1)) # [ 1 2 6 9 11 13]
print(np.cumprod(arr1)) # [ 1 1 4 12 24 48]
print(np.cumprod(arr1, axis=1))
# [[ 1 1 4]
# [ 3 6 12]]
1.7.3 比较函数
| 函数 | 说明 |
|---|---|
| np.any() | 至少有一个元素满足指定条件,就返回True |
| np.all() | 所有的元素都满足指定条件,才返回True |
1 | arr1 = np.array([1, 2, 3, 4, 5]) |
1.7.4 排序函数
**ndarray.sort()**:就地排序(直接修改原数组)。
1
2
3
4
5
6
7
8
9
10
11
12
13
14
15
16
17
18
19import numpy as np
arr1 = np.random.randint(0, 10, (3, 3))
print(arr1)
# [[7 4 4]
# [5 9 4]
# [3 3 5]]
arr1.sort()
print(arr1)
# [[4 4 7]
# [4 5 9]
# [3 3 5]]
arr1.sort(axis=0)
print(arr1)
# [[3 3 5]
# [4 4 7]
# [4 5 9]]- axis:指定排序的轴。默认值为 -1,表示沿着最后一个轴进行排序。在二维数组中,axis = 0 表示按列排序,axis = 1 表示按行排序。
- 在 NumPy 中,轴是对数组维度的一种抽象描述。对于多维数组,每个维度都对应一个轴,轴的编号从 0 开始。对于二维数组,它有两个轴:
- 轴 0:代表垂直方向,也就是行的方向。可以把二维数组想象成一个表格,轴 0 就像是表格中从上到下的行索引方向对列数据排序,所以axis=0表示按列排序。
- 轴 1:代表水平方向,也就是列的方向。就像是表格中从左到右的列索引方向对行数据进行排序,所以axis=1表示按行排序。
**np.sort()**:返回排序后的副本(创建新的数组)。
1
2
3
4
5
6
7
8
9
10
11
12import numpy as np
arr1 = np.random.randint(0, 10, (3, 3))
print(arr1)
# [[9 3 3]
# [2 4 4]
# [3 1 9]]
print(np.sort(arr1))
# [[3 3 9]
# [2 4 4]
# [1 3 9]]
1.7.5 去重函数
**np.unique()**:计算唯一值并返回有序结果。
1
2
3
4
5
6
7
8
9
10import numpy as np
arr1 = np.random.randint(0, 5, (3, 3))
print(arr1)
# [[3 2 0]
# [2 4 0]
# [1 2 3]]
print(np.unique(arr1))
# [0 1 2 3 4]
1.8 基本运算
numpy中的数组不用编写循环即可执行批量运算,称之为矢量化运算。
大小相等的数组之间的任何算术运算都会将运算应用到元素级。
1
2
3
4
5
6
7
8
9
10
11
12
13
14
15
16
17
18
19import numpy as np
arr1 = np.array([[1, 2, 3], [4, 5, 6]])
arr2 = np.array([[7, 8, 9], [10, 11, 12]])
print(arr1 + arr2)
# [[ 8 10 12]
# [14 16 18]]
print(arr1 - arr2)
# [[-6 -6 -6]
# [-6 -6 -6]]
print(arr1 * arr2)
# [[ 7 16 27]
# [40 55 72]]
print(arr1 / arr2)
# [[0.14285714 0.25 0.33333333]
# [0.4 0.45454545 0.5 ]]广播机制是 NumPy 中一个强大的特性,它允许在不同形状的数组之间进行元素级运算。广播机制的规则如下:
规则1:如果俩个数组的维度数不相同,那么小维度数组的形状将会在最左边补1。
1
2
3
4
5
6
7
8
9
10
11
12
13
14import numpy as np
# 一维数组
arr1 = np.array([1, 2, 3]) # 形状为 (3,)
# 二维数组
arr2 = np.array([[4], [5], [6]]) # 形状为 (3, 1)
# 对 arr1 应用规则 1,在其形状最左边补 1,变为 (1, 3) [[1,2,3]]
# 此时 arr1 形状 (1, 3) 和 arr2 形状 (3, 1) 满足广播条件
result = arr1 + arr2
print("规则 1 示例结果:\n", result)
# 规则 1 示例结果:
# [[5 6 7]
# [6 7 8]
# [7 8 9]]规则2:如果俩个数组的形状在任何一个维度上都不匹配,那么数组的形状会沿着维度大小(元素个数)为1的维度开始扩展 ,(维度必须是1开始)直到所有维度都一样, 以匹配另一个数组的形状。
1
2
3
4
5
6
7
8
9
10
11
12
13
14
15import numpy as np
# 二维数组
arr3 = np.array([[1, 2, 3]]) # 形状为 (1, 3)
# 二维数组
arr4 = np.array([[4], [5], [6]]) # 形状为 (3, 1)
# arr3 沿着第0个维度扩展,将原有的一行数据复制成3行,为 (3, 3)=>[[1,2,3], [1,2,3], [1,2,3]]
# arr4 沿着第1个维度扩展, (3, 3)=>[[4,4,4], [5,5,5], [6,6,6]]
result = arr3 + arr4
print("规则 2 示例结果:\n", result)
# 规则 2 示例结果:
# [[5 6 7]
# [6 7 8]
# [7 8 9]]规则3:如果俩个数组的形状在任何一个维度上都不匹配,并且没有任何一个维度大小等于1,那么会引发异常。
1
2
3
4
5
6
7
8
9
10
11import numpy as np
# 一维数组
arr5 = np.array([1, 2, 3]) # 形状为 (3,)
# 一维数组
arr6 = np.array([4, 5]) # 形状为 (2,)
try:
result = arr5 + arr6
print(result)
except ValueError as e:
print(f"规则 3 示例错误信息:{e}") # 规则 3 示例错误信息:operands could not be broadcast together with shapes (3,) (2,)
1.9 矩阵乘法
通过*运算符和np.multiply()对两个数组相乘进行的是对位乘法而非矩阵乘法运算。
1
2
3
4
5
6
7
8
9
10
11import numpy as np
arr1 = np.array([[1, 2, 3], [4, 5, 6]])
arr2 = np.array([[6, 5, 4], [3, 2, 1]])
print(arr1 * arr2)
# [[ 6 10 12]
# [12 10 6]]
print(np.multiply(arr1, arr2))
# [[ 6 10 12]
# [12 10 6]]使用np.dot()、ndarray.dot()、@可以进行矩阵乘法运算。
1
2
3
4
5
6
7
8
9
10
11
12
13
14
15
16
17
18
19
20
21
22
23
24
25
26
27
28
29
30
31
32
33import numpy as np
arr1 = np.array([[1, 2, 3], [4, 5, 6]])
arr2 = np.array([[6, 5], [4, 3], [2, 1]])
#对于矩阵乘法来说,要求第一个矩阵的列数等于第二个矩阵的行数
print(arr1)
# [[1 2 3]
# [4 5 6]]
print(arr2)
# [[6 5]
# [4 3]
# [2 1]]
print(arr1.shape, arr2.shape)
# (2, 3) (3, 2)
print(np.dot(arr1, arr2))
# [[20 14]
# [56 41]]
print(arr1.dot(arr2))
# [[20 14]
# [56 41]]
print(arr1 @ arr2)
# [[20 14]
# [56 41]]
# 一个二维数组跟一个大小合适的一维数组的矩阵点积运算之后将会得到一个一维数组
arr3 = np.array([6, 5, 4])
print(arr1 @ arr3)
# [28 73]矩阵乘法的规则是:结果矩阵中第 i 行第 j 列的元素等于第一个矩阵的第 i 行与第二个矩阵的第 j 列对应元素乘积之和。
- 结果矩阵第一行第一列的元素:计算 arr1 的第一行 [1, 2, 3] 与 arr2 的第一列 [6, 4, 2] 对应元素乘积之和,即 1*6 + 2*4 + 3*2 = 6 + 8 + 6 = 20。
- 结果矩阵第一行第二列的元素:计算 arr1 的第一行 [1, 2, 3] 与 arr2 的第二列 [5, 3, 1] 对应元素乘积之和,即 1*5 + 2*3 + 3*1 = 5 + 6 + 3 = 14。
- 结果矩阵第二行第一列的元素:计算 arr1 的第二行 [4, 5, 6] 与 arr2 的第一列 [6, 4, 2] 对应元素乘积之和,即 4*6 + 5*4 + 6*2 = 24 + 20 + 12 = 56。
- 结果矩阵第二行第二列的元素:计算 arr1 的第二行 [4, 5, 6] 与 arr2 的第二列 [5, 3, 1] 对应元素乘积之和,即 4*5 + 5*3 + 6*1 = 20 + 15 + 6 = 41。
- 所以,手动计算得到的结果矩阵是 [[20, 14], [56, 41]]。
2、Pandas
2.1 什么是Pandas
Pandas 是一个开源的数据分析和数据处理库,它是基于 Python 编程语言的。
Pandas 提供了易于使用的数据结构和数据分析工具,特别适用于处理结构化数据,如表格型数据(类似于Excel表格)。
Pandas 是数据科学和分析领域中常用的工具之一,它使得用户能够轻松地从各种数据源中导入数据,并对数据进行高效的操作和分析。
用得最多的pandas对象是Series,一个一维的标签化数组对象,另一个是DataFrame,它是一个面向列的二维表结构。
![image-20250626202451123]()
![image-20250626202505391]()
pandas兼具numpy高性能的数组计算功能以及电子表格和关系型数据库(如SQL)灵活的数据处理功能。它提供了复杂精细的索引功能,能更加便捷地完成重塑、切片和切块、聚合以及选取数据子集等操作。
pandas功能:
- 有标签轴的数据结构:在数据结构中,每个轴都被赋予了特定的标签,这些标签用于标识和引用轴上的数据元素,使得数据的组织、访问和操作更加直观和方便。
- 集成时间序列功能。
- 相同的数据结构用于处理时间序列数据和非时间序列数据。
- 保存元数据的算术运算和压缩。
- 灵活处理缺失数据。
- 合并和其它流行数据库(例如基于SQL的数据库)的关系操作。
pandas这个名字源于panel data(面板数据,这是多维结构化数据集在计量经济学中的术语)以及Python data analysis(Python数据分析)。
2.2 Pandas数据结构-Series
2.2.1 什么是Series
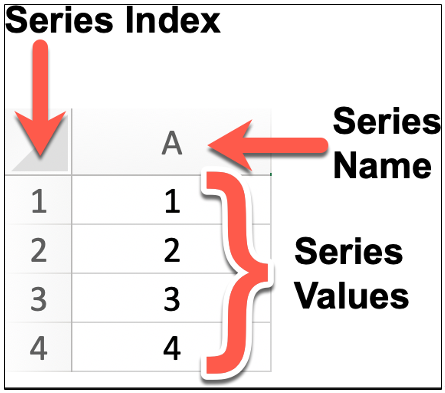
Series 是 Pandas 中的一个核心数据结构,类似于一个一维的数组,具有数据和索引。
Series 可以存储任何数据类型(整数、浮点数、字符串等),并通过标签(索引)来访问元素。Series 的数据结构是非常有用的,因为它可以处理各种数据类型,同时保持了高效的数据操作能力,比如可以通过标签来快速访问和操作数据。
![image-20250626203503548]()
Series 特点:
- 一维数组:Series 中的每个元素都有一个对应的索引值。
- 索引: 每个数据元素都可以通过标签(索引)来访问,默认情况下索引是从 0 开始的整数,但你也可以自定义索引。
- 数据类型: Series 可以容纳不同数据类型的元素,包括整数、浮点数、字符串、Python 对象等。
- 大小不变性:Series 的大小在创建后是不变的,但可以通过某些操作(如 append 或 delete)来改变。
- 操作:Series 支持各种操作,如数学运算、统计分析、字符串处理等。
- 缺失数据:Series 可以包含缺失数据,Pandas 使用NaN(Not a Number)来表示缺失或无值。
- 自动对齐:当对多个 Series 进行运算时,Pandas 会自动根据索引对齐数据,这使得数据处理更加高效。
我们可以使用 Pandas 库来创建一个 Series 对象,并且可以为其指定索引(Index)、名称(Name)以及值(Values)。
2.2.2 Series的创建
安装pandas包。
1
conda install pandas
直接通过列表创建Series。
1
2
3
4
5
6
7
8
9import pandas as pd
s = pd.Series([4, 7, -5, 3])
print(s)
# 0 4
# 1 7
# 2 -5
# 3 3
# dtype: int64- Series的字符串表现形式为:索引在左边,值在右边。由于我们没有为数据指定索引,于是会自动创建一个0到N-1(N为数据的长度)的整数型索引。
通过列表创建Series时指定索引。
1
2
3
4
5
6
7
8
9import pandas as pd
s = pd.Series([4, 7, -5, 3], index=["a", "b", "c", "d"])
print(s)
# a 4
# b 7
# c -5
# d 3
# dtype: int64通过列表创建Series时指定索引和名称。
1
2
3
4
5
6
7
8
9import pandas as pd
s = pd.Series([4, 7, -5, 3], index=["a", "b", "c", "d"],name="hello_python")
print(s)
# a 4
# b 7
# c -5
# d 3
# Name: hello_python, dtype: int6直接通过字典创建Series。
1
2
3
4
5
6
7
8
9
10
11
12
13
14
15import pandas as pd
dic = {"a": 4, "b": 7, "c": -5, "d": 3}
s = pd.Series(dic)
print(s)
# a 4
# b 7
# c -5
# d 3
# dtype: int64
s1 = pd.Series(dic,index=["a","c"],name="aacc")
print(s1)
# a 4
# c -5
# Name: aacc, dtype: int64
2.2.3 Series的常用属性
| 属性 | 说明 |
|---|---|
| index | Series的索引 |
| values | Series的值 |
| ndim | Series的维度 |
| shape | Series的形状 |
| size | Series的元素个数 |
| dtype或dtypes | Series的元素类型 |
| name | Series的名称 |
| loc[] | 显式索引,按标签索引或切片 |
| iloc[] | 隐式索引,按位置索引或切片 |
| at[] | 使用标签访问单个元素 |
| iat[] | 使用位置访问单个元素 |
1 | import pandas as pd |
2.2.4 Series的常用方法
| 方法 | 说明 |
|---|---|
| head() | 查看前n行数据,默认5行 |
| tail() | 查看后n行数据,默认5行 |
| isin() | 元素是否包含在参数集合中 |
| isna() | 元素是否为缺失值(通常为 NaN 或 None) |
| sum() | 求和,会忽略 Series 中的缺失值 |
| mean() | 平均值 |
| min() | 最小值 |
| max() | 最大值 |
| var() | 方差 |
| std() | 标准差 |
| median() | 中位数 |
| mode() | 众数(出现频率最高的值),如果有多个值出现的频率相同且都是最高频率,这些值都会被包含在返回的 Series 中 |
| quantile(q,interpolation) | 指定位置的分位数 q的取值范围是 0 到 1 之间的浮点数或浮点数列表,如quantile(0.5)表示计算中位数(即第 50 百分位数); interpolation:指定在计算分位数时,如果分位数位置不在数据点上,采用的插值方法。默认值是线性插值 ‘linear’,还有其他可选值如 ‘lower’、’higher’、’midpoint’、’nearest’ 等 |
| describe() | 常见统计信息 |
| value_count() | 每个元素的个数 |
| count() | 非缺失值元素的个数,如果要包含缺失值,用len() |
| drop_duplicates() | 去重 |
| unique() | 去重后的数组 |
| nunique() | 去重后元素个数 |
| sample() | 随机采样 |
| sort_index() | 按索引排序 |
| sort_values() | 按值排序 |
| replace() | 用指定值代替原有值 |
| to_frame() | 将Series转换为DataFrame |
| equals() | 判断两个Series是否相同 |
| keys() | 返回Series的索引对象 |
| corr() | 计算与另一个Series的相关系数 默认使用皮尔逊相关系数(Pearson correlation coefficient)来计算相关性。要求参与比较的数组元素类型都是数值型。 当相关系数为 1 时,表示两个变量完全正相关,即一个变量增加,另一个变量也随之增加。 当相关系数为 -1 时,表示两个变量完全负相关,即一个变量增加,另一个变量随之减少。 当相关系数为 0 时,表示两个变量之间不存在线性相关性。 例如,分析某地区的气温和冰淇淋销量之间的关系 |
| cov() | 计算与另一个Series的协方差 |
| hist() | 绘制直方图,用于展示数据的分布情况。它将数据划分为若干个区间(也称为 “bins”),并统计每个区间内数据的频数。 需要安装matplotlib包 |
| items() | 获取索引名以及值 |
1 | import pandas as pd |
2.2.5 Series的布尔索引
可以使用布尔索引从Series中筛选满足某些条件的值。
1
2
3
4
5
6
7
8
9
10
11
12
13
14
15import pandas as pd
s = pd.Series({"a": -1.2, "b": 3.5, "c": 6.8, "d": 2.9})
bools = s > s.mean() # 将大于平均值的元素标记为 True
print(bools)
# a False
# b True
# c True
# d False
# dtype: bool
print(s[bools])
# b 3.5
# c 6.8
# dtype: float64
2.2.6 Series的运算
Series与标量运算:标量会与每个元素进行计算。
1
2
3
4
5
6
7s = pd.Series({"a": -1.2, "b": 3.5, "c": 6.8, "d": 2.9})
print(s * 10)
# a -12.0
# b 35.0
# c 68.0
# d 29.0
# dtype: float64Series与Series运算:会根据标签索引进行对位计算,索引没有匹配上的会用NaN填充。
1
2
3
4
5
6
7
8
9s1 = pd.Series([1, 1, 1, 1])
s2 = pd.Series([2, 2, 2, 2], index=[1, 2, 3, 4])
print(s1 + s2)
# 0 NaN
# 1 3.0
# 2 3.0
# 3 3.0
# 4 NaN
# dtype: float64
2.3 Pandas数据结构-DataFrame
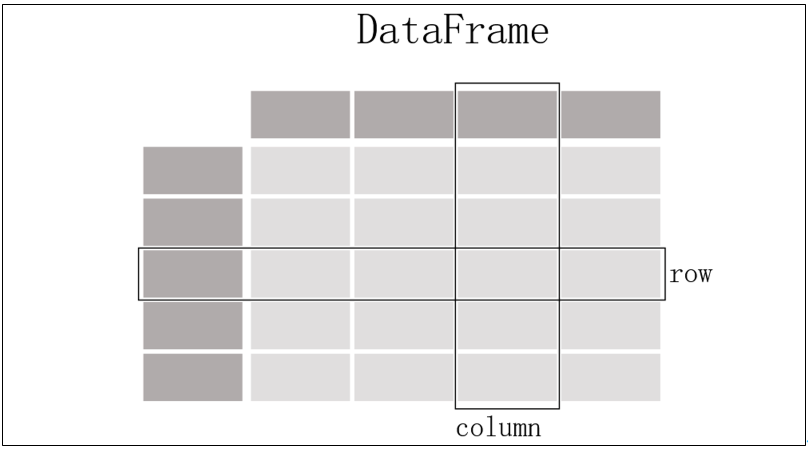
DataFrame是Pandas 中的另一个核心数据结构,类似于一个二维的表格或数据库中的数据表。它是一个表格型的数据结构,它含有一组有序的列,每列可以是不同的值类型(数值、字符串、布尔型值),既有行索引也有列索引。
![image-20250628130607509]()
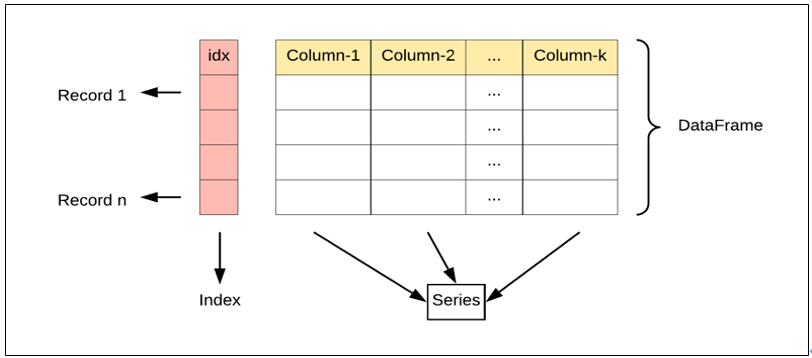
DataFrame中的数据是以一个或多个二维块存放的(而不是列表、字典或别的一维数据结构)。它可以被看做由Series组成的字典(共同用一个索引)。提供了各种功能来进行数据访问、筛选、分割、合并、重塑、聚合以及转换等操作,广泛用于数据分析、清洗、转换、可视化等任务。
![image-20250628130709031]()
2.3.1 DataFrame的创建
直接通过字典创建DataFrame
1
2
3
4
5
6df = pd.DataFrame({"id": [101, 102, 103], "name": ["张三", "李四", "王五"], "age": [20, 30, 40]})
print(df)
# id name age
# 0 101 张三 20
# 1 102 李四 30
# 2 103 王五 40通过字典创建时指定列的顺序和行索引
1
2
3
4
5
6
7
8df = pd.DataFrame(
data={"age": [20, 30, 40], "name": ["张三", "李四", "王五"]}, columns=["name", "age"], index=[101, 102, 103]
)
print(df)
# name age
# 101 张三 20
# 102 李四 30
# 103 王五 40
2.3.2 DataFrame的常用属性
| 属性 | 说明 |
|---|---|
| index | DataFrame的行索引 |
| columns | DataFrame的列标签 |
| values | DataFrame的值 |
| ndim | DataFrame的维度 |
| shape | DataFrame的形状 |
| size | DataFrame的元素个数 |
| dtypes | DataFrame的元素类型 |
| T | 行列转置 |
| loc[] | 显式索引,按行列标签索引或切片 |
| iloc[] | 隐式索引,按行列位置索引或切片 |
| at[] | 使用行列标签访问单个元素 |
| iat[] | 使用行列位置访问单个元素 |
1 | import pandas as pd |
2.3.3 DataFrame的常用方法
| 方法 | 说明 |
|---|---|
| head() | 查看前n行数据,默认5行 |
| tail() | 查看后n行数据,默认5行 |
| isin() | 元素是否包含在参数集合中 |
| isna() | 元素是否为缺失值 |
| sum() | 求和 |
| mean() | 平均值 |
| min() | 最小值 |
| max() | 最大值 |
| var() | 方差 |
| std() | 标准差 |
| median() | 中位数 |
| mode() | 众数 |
| quantile() | 指定位置的分位数,如quantile(0.5) |
| describe() | 常见统计信息 |
| info() | 基本信息 |
| value_counts() | 每个元素的个数 |
| count() | 非空元素的个数 |
| drop_duplicates() | 去重 |
| sample() | 随机采样 |
| replace() | 用指定值代替原有值 |
| equals() | 判断两个DataFrame是否相同 |
| cummax() | 累计最大值 |
| cummin() | 累计最小值 |
| cumsum() | 累计和 |
| cumprod() | 累计积 |
| diff() | 一阶差分,对序列中的元素进行差分运算,也就是用当前元素减去前一个元素得到差值,默认情况下,它会计算一阶差分,即相邻元素之间的差值。参数: periods:整数,默认为 1。表示要向前或向后移动的周期数,用于计算差值。正数表示向前移动,负数表示向后移动。 axis:指定计算的轴方向。0 或 ‘index’ 表示按列计算,1 或 ‘columns’ 表示按行计算,默认值为 0。 |
| sort_index() | 按行索引排序 |
| sort_values() | 按某列的值排序,可传入列表来按多列排序,并通过ascending参数设置升序或降序 |
| nlargest() | 返回某列最大的n条数据 |
| nsmallest() | 返回某列最小的n条数据 |
- 在Pandas的 DataFrame 方法里,axis 是一个非常重要的参数,它用于指定操作的方向。axis 参数可以取两个主要的值,即 0 或 ‘index’,以及 1 或 ‘columns’ ,其含义如下:
- axis=0 或 axis=’index’:表示操作沿着行的方向进行,也就是对每一列的数据进行处理。例如,当计算每列的均值时,就是对每列中的所有行数据进行计算。
- axis=1 或 axis=’columns’:表示操作沿着列的方向进行,也就是对每行的数据进行处理。例如,当计算每行的总和时,就是对每行中的所有列数据进行计算。
1 | import pandas as pd |
2.3.4 DataFrame的布尔索引
可以使用布尔索引从DataFrame中筛选满足某些条件的行。
1
2
3
4
5
6
7
8
9
10
11
12
13
14
15
16
17
18import pandas as pd
df = pd.DataFrame(
data={"age": [20, 30, 40, 10], "name": ["张三", "李四", "王五", "赵六"]},
columns=["name", "age"],
index=[101, 104, 103, 102],
)
print(df["age"] > 25)
# 101 False
# 104 True
# 103 True
# 102 False
# Name: age, dtype: bool
print(df[df["age"] > 25])
# name age
# 104 李四 30
# 103 王五 40
2.3.5 DataFrame的运算
DataFrame与标量运算:标量与每个元素进行计算。
1
2
3
4
5
6
7
8
9
10
11df = pd.DataFrame(
data={"age": [20, 30, 40, 10], "name": ["张三", "李四", "王五", "赵六"]},
columns=["name", "age"],
index=[101, 104, 103, 102],
)
print(df * 2)
# name age
# 101 张三张三 40
# 104 李四李四 60
# 103 王五王五 80
# 102 赵六赵六 20DataFrame与DataFrame运算:根据标签索引进行对位计算,索引没有匹配上的用NaN填充。
1
2
3
4
5
6
7
8
9
10
11
12
13
14
15
16
17df1 = pd.DataFrame(
data={"age": [10, 20, 30, 40], "name": ["张三", "李四", "王五", "赵六"]},
columns=["name", "age"],
index=[101, 102, 103, 104],
)
df2 = pd.DataFrame(
data={"age": [10, 20, 30, 40], "name": ["张三", "李四", "王五", "田七"]},
columns=["name", "age"],
index=[102, 103, 104, 105],
)
print(df1 + df2)
# name age
# 101 NaN NaN
# 102 李四张三 30.0
# 103 王五李四 50.0
# 104 赵六王五 70.0
# 105 NaN NaN
2.3.6 DataFrame的更改操作
设置行索引:创建DataFrame时如果不指定行索引,pandas会自动添加从0开始的索引。
1
2
3
4
5
6
7df = pd.DataFrame({"age": [20, 30, 40, 10], "name": ["张三", "李四", "王五", "赵六"], "id": [101, 102, 103, 104]})
print(df)
# age name id
# 0 20 张三 101
# 1 30 李四 102
# 2 40 王五 103
# 3 10 赵六 104通过set_index()设置行索引。
1
2
3
4
5
6
7
8df.set_index("id", inplace=True) # 设置行索引
print(df)
# age name
# id
# 101 20 张三
# 102 30 李四
# 103 40 王五
# 104 10 赵六通过reset_index()重置行索引。
1
2
3
4
5
6
7df.reset_index(inplace=True) # 重置索引
print(df)
# id age name
# 0 101 20 张三
# 1 102 30 李四
# 2 103 40 王五
# 3 104 10 赵六
修改行索引名和列名。
通过rename()修改行索引名和列名。
1
2
3
4
5
6
7
8
9
10
11
12
13
14
15
16
17
18df = pd.DataFrame({"age": [20, 30, 40, 10], "name": ["张三", "李四", "王五", "赵六"], "id": [101, 102, 103, 104]})
df.set_index("id", inplace=True)
print(df)
# age name
# id
# 101 20 张三
# 102 30 李四
# 103 40 王五
# 104 10 赵六
df.rename(index={101: "一", 102: "二", 103: "三", 104: "四"}, columns={"age": "年龄", "name": "姓名"}, inplace=True)
print(df)
# 年龄 姓名
# id
# 一 20 张三
# 二 30 李四
# 三 40 王五
# 四 10 赵六将index和columns重新赋值。
1
2
3
4
5
6
7
8df.index = ["Ⅰ", "Ⅱ", "Ⅲ", "Ⅳ"]
df.columns = ["年齡", "名稱"]
print(df)
# 年齡 名稱
# Ⅰ 20 张三
# Ⅱ 30 李四
# Ⅲ 40 王五
# Ⅳ 10 赵六
添加列:通过 df[“列名”] 添加列。
1
2
3
4
5
6
7
8df["phone"] = ["13333333333", "14444444444", "15555555555", "16666666666"]
print(df)
# age name phone
# id
# 101 20 张三 13333333333
# 102 30 李四 14444444444
# 103 40 王五 15555555555
# 104 10 赵六 16666666666删除列。
通过 df.drop(“列名”, axis=1) 删除。
1
2
3
4
5
6
7
8df.drop("phone", axis=1, inplace=True) # 删除phone,按列删除,inplace=True表示直接在原对象上修改
print(df)
# age name
# id
# 101 20 张三
# 102 30 李四
# 103 40 王五
# 104 10 赵六通过 del df[“列名”] 删除。
1
2
3
4
5
6
7
8del df["phone"]
print(df)
# age name
# id
# 101 20 张三
# 102 30 李四
# 103 40 王五
# 104 10 赵六
插入列:通过 insert(loc, column, value) 插入。该方法没有inplace参数,直接在原数据上修改。
1
2
3
4
5
6
7
8df.insert(loc=0, column="phone", value=df["age"] * df.index)
print(df)
# phone age name
# id
# 101 2020 20 张三
# 102 3060 30 李四
# 103 4120 40 王五
# 104 1040 10 赵六
2.3.7 DataFrame数据的导入与导出
导出数据
方法 说明 to_csv() 将数据保存为csv格式文件,数据之间以逗号分隔,可通过sep参数设置使用其他分隔符,可通过index参数设置是否保存行标签,可通过header参数设置是否保存列标签。 to_pickle() 如要保存的对象是计算的中间结果,或者保存的对象以后会在Python中复用,可把对象保存为.pickle文件。如果保存成pickle文件,只能在python中使用。文件的扩展名可以是.p、.pkl、.pickle。 to_excel() 保存为Excel文件,需安装openpyxl包。 to_clipboard() 保存到剪切板。 to_dict() 保存为字典。 to_hdf() 保存为HDF格式,需安装tables包。 to_html() 保存为HTML格式,需安装lxml、html5lib、beautifulsoup4包。 to_json() 保存为JSON格式。 to_feather() feather是一种文件格式,用于存储二进制对象。feather对象也可以加载到R语言中使用。feather格式的主要优点是在Python和R语言之间的读写速度要比csv文件快。feather数据格式通常只用中间数据格式,用于Python和R之间传递数据,一般不用做保存最终数据。需安装pyarrow包。 to_sql() 保存到数据库。 1
2
3
4
5
6
7
8
9
10
11
12
13
14
15
16
17
18import os
import pandas as pd
os.makedirs("data", exist_ok=True)
df = pd.DataFrame({"age": [20, 30, 40, 10], "name": ["张三", "李四", "王五", "赵六"], "id": [101, 102, 103, 104]})
df.set_index("id", inplace=True)
df.to_csv("data/df.csv")
df.to_csv("data/df.tsv", sep="\t") # 设置分隔符为 \t
df.to_csv("data/df_noindex.csv", index=False) # index=False 不保存行索引
df.to_pickle("data/df.pkl")
df.to_excel("data/df.xlsx")
df.to_clipboard()
df_dict = df.to_dict()
df.to_hdf("data/df.h5", key="df")
df.to_html("data/df.html")
df.to_json("data/df.json")
df.to_feather("data/df.feather")导入数据
方法 说明 read_csv() 加载csv格式的数据。可通过sep参数指定分隔符,可通过index_col参数指定行索引。 read_pickle() 加载pickle格式的数据。 read_excel() 加载Excel格式的数据。 read_clipboard() 加载剪切板中的数据。 read_hdf() 加载HDF格式的数据。 read_html() 加载HTML格式的数据。 read_json() 加载JSON格式的数据。 read_feather() 加载feather格式的数据。 read_sql() 加载数据库中的数据。 1
2
3
4
5
6
7
8
9
10
11
12
13
14
15
16
17
18
19
20
21df_csv = pd.read_csv("data/df.csv", index_col="id") # 指定行索引
df_tsv = pd.read_csv("data/df.tsv", sep="\t") # 指定分隔符
df_pkl = pd.read_pickle("data/df.pkl")
df_excel = pd.read_excel("data/df.xlsx", index_col="id")
df_clipboard = pd.read_clipboard(index_col="id")
df_from_dict = pd.DataFrame(df_dict)
df_hdf = pd.read_hdf("data/df.h5", key="df")
df_html = pd.read_html("data/df.html", index_col=0)[0]
df_json = pd.read_json("data/df.json")
df_feather = pd.read_feather("data/df.feather")
print(df_csv)
print(df_tsv)
print(df_pkl)
print(df_excel)
print(df_clipboard)
print(df_from_dict)
print(df_hdf)
print(df_html)
print(df_json)
print(df_feather)
2.4 Pandas日期数据处理初识
2.4.1 to_datetime()进行日期格式转换
参数说明
参数名 说明 arg 要转换为日期时间的对象 errors ignore,raise,coerce, 默认为ignore,表示无效的解析将会返回原值 dayfirst 指定日期解析顺序。如果为True,则以日期开头解析日期,例如:“10/11/12”解析为2012-11-10。默认false yearfirst 如果为True,则以日期开头解析,例如:“10/11/12”解析为2010-11-12。如果dayfirst和yearfirst都为True,则yearfirst在前面。默认false。当日期字符串格式不明确时,指定年份是否在最前面。当日期字符串是 ‘2010/1/4’ 这种形式,由于年份是 4 位数字,pandas 能很清晰地识别出这是年份,所以即使 yearfirst 为 False,也不会影响其正确解析 utc 返回utc,即协调世界时间 format 格式化显示时间的格式,字符串,默认值为None exact 要求格式完全匹配 unit 参数的单位表示时间的单位 infer_datetime_format 如果为True且未给出格式,则尝试基于第一个非nan元素推断datetime字符串的格式,如果可以推断,则切换到更快的解析方法。在某些情况下,这可以将解析速度提高5-10倍。 origin 默认值为unix,定义参考日期1970-01-01 cache 使用唯一的已转换日期缓存来应用日期时间转换。在解析重复日期字符串时产生显著的加速。 将字符串字段转换为日期类型
1
2
3
4
5
6
7
8
9
10import pandas as pd
df = pd.DataFrame({"gmv":[100,200,300,400],"trade_date":["2025-01-06","2023-10-31","2023-12-31","2023-01-05"]})
df["ymd"] = pd.to_datetime(df["trade_date"])
print(df)
# gmv trade_date ymd
# 0 100 2025-01-06 2025-01-06
# 1 200 2023-10-31 2023-10-31
# 2 300 2023-12-31 2023-12-31
# 3 400 2023-01-05 2023-01-05
2.4.2 时间属性访问器对象Series.dt,获取日期数据的年月日星期
获取年月日
1
2
3
4
5
6
7
8
9
10
11import pandas as pd
df = pd.DataFrame({"gmv":[100,200,300,400],"trade_date":["2025-01-06","2023-10-31","2023-12-31","2023-01-05"]})
df["ymd"] = pd.to_datetime(df["trade_date"])
df['yy'],df['mm'],df['dd']=df['ymd'].dt.year,df['ymd'].dt.month,df['ymd'].dt.day
print(df)
# gmv trade_date ymd yy mm dd
# 0 100 2025-01-06 2025-01-06 2025 1 6
# 1 200 2023-10-31 2023-10-31 2023 10 31
# 2 300 2023-12-31 2023-12-31 2023 12 31
# 3 400 2023-01-05 2023-01-05 2023 1 5获取星期
1
2
3
4
5
6
7
8
9
10
11import pandas as pd
df = pd.DataFrame({"gmv":[100,200,300,400],"trade_date":["2025-01-06","2023-10-31","2023-12-31","2023-01-05"]})
df["ymd"] = pd.to_datetime(df["trade_date"])
df['week']=df['ymd'].dt.day_name()
print(df)
# gmv trade_date ymd week
# 0 100 2025-01-06 2025-01-06 Monday
# 1 200 2023-10-31 2023-10-31 Tuesday
# 2 300 2023-12-31 2023-12-31 Sunday
# 3 400 2023-01-05 2023-01-05 Thursday获取日期所在季度
1
2
3
4
5
6
7
8
9
10
11import pandas as pd
df = pd.DataFrame({"gmv":[100,200,300,400],"trade_date":["2025-01-06","2023-10-31","2023-12-31","2023-01-05"]})
df["ymd"] = pd.to_datetime(df["trade_date"])
df['quarter']=df['ymd'].dt.quarter
print(df)
# gmv trade_date ymd quarter
# 0 100 2025-01-06 2025-01-06 1
# 1 200 2023-10-31 2023-10-31 4
# 2 300 2023-12-31 2023-12-31 4
# 3 400 2023-01-05 2023-01-05 1判断日期是否月底年底
1
2
3
4
5
6
7
8
9
10
11
12import pandas as pd
df = pd.DataFrame({"gmv":[100,200,300,400],"trade_date":["2025-01-06","2023-10-31","2023-12-31","2023-01-05"]})
df["ymd"] = pd.to_datetime(df["trade_date"])
df['mend']=df['ymd'].dt.is_month_end
df['yend']=df['ymd'].dt.is_year_end
print(df)
# gmv trade_date ymd mend yend
# 0 100 2025-01-06 2025-01-06 False False
# 1 200 2023-10-31 2023-10-31 True False
# 2 300 2023-12-31 2023-12-31 True True
# 3 400 2023-01-05 2023-01-05 False False
2.4.3 to_period()获取统计周期
freq:这是 to_period() 方法最重要的参数,用于指定要转换的时间周期频率。常见的取值如下:
- “D”:按天周期,例如 2024-01-01 会转换为 2024-01-01 这个天的周期。
- “W”:按周周期,通常以周日作为一周的结束,比如日期落在某一周内,就会转换为该周的周期表示。
- “M”:按月周期,像 2024-05-15 会转换为 2024-05。
- “Q”:按季度周期,一年分为四个季度,日期会转换到对应的季度周期,例如 2024Q2 。
- “A” 或 “Y”:按年周期,如 2024-07-20 会转换为 2024 。
1
2
3
4
5
6
7
8
9
10
11
12
13
14import pandas as pd
df = pd.DataFrame({"gmv":[100,200,300,400],"trade_date":["2025-01-06","2023-10-31","2023-12-31","2023-01-05"]})
df["ymd"] = pd.to_datetime(df["trade_date"])
df["ystat"] = df["ymd"].dt.to_period("Y")
df["mstat"] = df["ymd"].dt.to_period("M")
df["qstat"] = df["ymd"].dt.to_period("Q")
df["wstat"] = df["ymd"].dt.to_period("W")
print(df)
# gmv trade_date ymd ystat mstat qstat wstat
# 0 100 2025-01-06 2025-01-06 2025 2025-01 2025Q1 2025-01-06/2025-01-12
# 1 200 2023-10-31 2023-10-31 2023 2023-10 2023Q4 2023-10-30/2023-11-05
# 2 300 2023-12-31 2023-12-31 2023 2023-12 2023Q4 2023-12-25/2023-12-31
# 3 400 2023-01-05 2023-01-05 2023 2023-01 2023Q1 2023-01-02/2023-01-08
2.5 DataFrame数据分析入门
2.5.1 加载数据集
使用weather(天气)数据集。其中包含6个字段:
- date:日期,年-月-日格式。
- precipitation:降水量。
- temp_max:最高温度。
- temp_min:最低温度。
- wind:风力。
- weather:天气状况。
1
2
3
4
5
6
7
8
9
10
11
12
13
14
15
16
17
18
19date,precipitation,temp_max,temp_min,wind,weather
2012-01-01,0.0,12.8,5.0,4.7,drizzle
2012-01-02,10.9,10.6,2.8,4.5,rain
2012-01-03,0.8,11.7,7.2,2.3,rain
2012-01-04,20.3,12.2,5.6,4.7,rain
2012-01-05,1.3,8.9,2.8,6.1,rain
2012-01-06,2.5,4.4,2.2,2.2,rain
2012-01-07,0.0,7.2,2.8,2.3,rain
2012-01-08,0.0,10.0,2.8,2.0,sun
2012-01-09,4.3,9.4,5.0,3.4,rain
2012-01-10,1.0,6.1,0.6,3.4,rain
2012-01-11,0.0,6.1,-1.1,5.1,sun
2012-01-12,0.0,6.1,-1.7,1.9,sun
2012-01-13,0.0,5.0,-2.8,1.3,sun
2012-01-14,4.1,4.4,0.6,5.3,snow
2012-01-15,5.3,1.1,-3.3,3.2,snow
2012-01-16,2.5,1.7,-2.8,5.0,snow
2012-01-17,8.1,3.3,0.0,5.6,snow
…………1
2
3
4
5
6
7
8
9
10
11
12
13
14
15
16
17
18
19
20
21
22
23
24
25
26
27
28
29
30
31
32
33
34
35
36
37
38
39
40import pandas as pd
df = pd.read_csv("data/weather.csv")
# 查看df类型
print(type(df))
# <class 'pandas.core.frame.DataFrame'>
# 查看df形状
print(df.shape)
# (1461, 6)
# 查看df的列名
print(df.columns)
# Index(['date', 'precipitation', 'temp_max', 'temp_min', 'wind', 'weather'], dtype='object')
# 查看df各列数据类型
print(df.dtypes)
# date object
# precipitation float64
# temp_max float64
# temp_min float64
# wind float64
# weather object
# dtype: object
# 查看df基本信息
df.info()
# <class 'pandas.core.frame.DataFrame'>
# RangeIndex: 1461 entries, 0 to 1460
# Data columns (total 6 columns):
# # Column Non-Null Count Dtype
# --- ------ -------------- -----
# 0 date 1461 non-null object
# 1 precipitation 1461 non-null float64
# 2 temp_max 1461 non-null float64
# 3 temp_min 1461 non-null float64
# 4 wind 1461 non-null float64
# 5 weather 1461 non-null object
# dtypes: float64(4), object(2)
# memory usage: 68.6+ KBpandas与Python常用数据类型对照:
pandas类型 Python类型 说明 object string 字符串类型 int64 int 整型 float64 float 浮点型 datetime64 datetime 日期时间类型
2.5.2 查看部分数据
通过head()、tail()获取前n行或后n行。
1
2
3
4
5
6
7
8
9
10
11
12
13
14
15
16
17
18
19
20
21
22
23import pandas as pd
df = pd.read_csv("data/weather.csv")
print(df.head())
# date precipitation temp_max temp_min wind weather
# 0 2012-01-01 0.0 12.8 5.0 4.7 drizzle
# 1 2012-01-02 10.9 10.6 2.8 4.5 rain
# 2 2012-01-03 0.8 11.7 7.2 2.3 rain
# 3 2012-01-04 20.3 12.2 5.6 4.7 rain
# 4 2012-01-05 1.3 8.9 2.8 6.1 rain
print(df.tail(10))
# date precipitation temp_max temp_min wind weather
# 1451 2015-12-22 4.6 7.8 2.8 5.0 rain
# 1452 2015-12-23 6.1 5.0 2.8 7.6 rain
# 1453 2015-12-24 2.5 5.6 2.2 4.3 rain
# 1454 2015-12-25 5.8 5.0 2.2 1.5 rain
# 1455 2015-12-26 0.0 4.4 0.0 2.5 sun
# 1456 2015-12-27 8.6 4.4 1.7 2.9 rain
# 1457 2015-12-28 1.5 5.0 1.7 1.3 rain
# 1458 2015-12-29 0.0 7.2 0.6 2.6 fog
# 1459 2015-12-30 0.0 5.6 -1.0 3.4 sun
# 1460 2015-12-31 0.0 5.6 -2.1 3.5 sun获取一列或多列数据。
加载一列数据。
1
2
3
4
5
6
7
8
9
10
11
12
13
14
15
16
17
18
19
20
21
22
23
24
25
26
27
28
29
30
31
32
33
34import pandas as pd
df = pd.read_csv("data/weather.csv")
df_date_series = df["date"] # 返回的是Series
print(df_date_series)
# 0 2012-01-01
# 1 2012-01-02
# 2 2012-01-03
# 3 2012-01-04
# 4 2012-01-05
# ...
# 1456 2015-12-27
# 1457 2015-12-28
# 1458 2015-12-29
# 1459 2015-12-30
# 1460 2015-12-31
# Name: date, Length: 1461, dtype: object
df_date_dataframe = df[["date"]] # 返回的是DataFrame
print(df_date_dataframe)
# date
# 0 2012-01-01
# 1 2012-01-02
# 2 2012-01-03
# 3 2012-01-04
# 4 2012-01-05
# ... ...
# 1456 2015-12-27
# 1457 2015-12-28
# 1458 2015-12-29
# 1459 2015-12-30
# 1460 2015-12-31
# [1461 rows x 1 columns]加载多列数据。
1
2
3
4
5
6
7
8
9
10
11
12
13
14
15
16
17
18import pandas as pd
df = pd.read_csv("data/weather.csv")
print(df[["date", "temp_max", "temp_min"]]) # 获取多列数据
# date temp_max temp_min
# 0 2012-01-01 12.8 5.0
# 1 2012-01-02 10.6 2.8
# 2 2012-01-03 11.7 7.2
# 3 2012-01-04 12.2 5.6
# 4 2012-01-05 8.9 2.8
# ... ... ... ...
# 1456 2015-12-27 4.4 1.7
# 1457 2015-12-28 5.0 1.7
# 1458 2015-12-29 7.2 0.6
# 1459 2015-12-30 5.6 -1.0
# 1460 2015-12-31 5.6 -2.1
# [1461 rows x 3 columns]
按行获取数据。
loc:通过行标签获取数据。
1
2
3
4
5
6
7
8
9
10
11
12
13
14
15
16
17import pandas as pd
df = pd.read_csv("data/weather.csv")
print(df.loc[1]) # 获取行标签为1的数据
# date 2012-01-02
# precipitation 10.9
# temp_max 10.6
# temp_min 2.8
# wind 4.5
# weather rain
# Name: 1, dtype: object
print(df.loc[[1, 10, 100]]) # 获取行标签分别为1、10、100的数据
# date precipitation temp_max temp_min wind weather
# 1 2012-01-02 10.9 10.6 2.8 4.5 rain
# 10 2012-01-11 0.0 6.1 -1.1 5.1 sun
# 100 2012-04-10 0.0 17.8 8.9 3.2 rainiloc:通过行位置获取数据。
1
2
3
4
5
6
7
8
9
10
11
12
13
14
15
16
17
18
19
20import pandas as pd
df = pd.read_csv("data/weather.csv")
print(df.iloc[0]) # 获取行位置为0的数据
# date 2012-01-01
# precipitation 0.0
# temp_max 12.8
# temp_min 5.0
# wind 4.7
# weather drizzle
# Name: 0, dtype: object
print(df.iloc[-1]) # 获取行位置为最后一位的数据
# date 2015-12-31
# precipitation 0.0
# temp_max 5.6
# temp_min -2.1
# wind 3.5
# weather sun
# Name: 1460, dtype: object
获取指定行与列的数据。
1
2
3
4
5
6
7
8
9
10
11
12
13
14
15
16
17
18
19
20
21
22
23
24
25
26
27
28
29
30
31
32
33
34
35
36
37
38
39
40
41
42
43
44
45
46
47
48
49
50
51
52
53
54
55
56
57
58
59
60
61
62import pandas as pd
df = pd.read_csv("data/weather.csv")
print(df.loc[1, "precipitation"]) # 获取行标签为1,列标签为precipitation的数据
# 10.9
print(df.loc[:, "precipitation"]) # 获取所有行,列标签为precipitation的数据
# 0 0.0
# 1 10.9
# 2 0.8
# 3 20.3
# 4 1.3
# ...
# 1456 8.6
# 1457 1.5
# 1458 0.0
# 1459 0.0
# 1460 0.0
# Name: precipitation, Length: 1461, dtype: float64
print(df.iloc[:, [3, 5, -1]]) # 获取所有行,列位置为3,5,最后一位的数据
# temp_min weather weather
# 0 5.0 drizzle drizzle
# 1 2.8 rain rain
# 2 7.2 rain rain
# 3 5.6 rain rain
# 4 2.8 rain rain
# ... ... ... ...
# 1456 1.7 rain rain
# 1457 1.7 rain rain
# 1458 0.6 fog fog
# 1459 -1.0 sun sun
# 1460 -2.1 sun sun
# [1461 rows x 3 columns]
print(df.iloc[:10, 2:6]) # 获取前10行,列位置为2、3、4、5的数据
# temp_max temp_min wind weather
# 0 12.8 5.0 4.7 drizzle
# 1 10.6 2.8 4.5 rain
# 2 11.7 7.2 2.3 rain
# 3 12.2 5.6 4.7 rain
# 4 8.9 2.8 6.1 rain
# 5 4.4 2.2 2.2 rain
# 6 7.2 2.8 2.3 rain
# 7 10.0 2.8 2.0 sun
# 8 9.4 5.0 3.4 rain
# 9 6.1 0.6 3.4 rain
print(df.loc[:10, ["date", "precipitation", "temp_max", "temp_min"]]) # 通过行列标签获取数据
# date precipitation temp_max temp_min
# 0 2012-01-01 0.0 12.8 5.0
# 1 2012-01-02 10.9 10.6 2.8
# 2 2012-01-03 0.8 11.7 7.2
# 3 2012-01-04 20.3 12.2 5.6
# 4 2012-01-05 1.3 8.9 2.8
# 5 2012-01-06 2.5 4.4 2.2
# 6 2012-01-07 0.0 7.2 2.8
# 7 2012-01-08 0.0 10.0 2.8
# 8 2012-01-09 4.3 9.4 5.0
# 9 2012-01-10 1.0 6.1 0.6
# 10 2012-01-11 0.0 6.1 -1.1
2.5.3 分组聚合计算
1 | df.groupby("分组字段")["要聚合的字段"].聚合函数() |
将数据按月分组,并统计最大温度和最小温度的平均值。
1
2
3
4
5
6
7
8
9
10
11
12
13
14
15
16
17
18
19
20
21
22
23
24
25
26
27
28
29
30
31
32
33
34
35
36
37
38
39
40
41
42
43
44
45
46
47
48
49
50
51
52
53
54
55
56
57
58
59
60
61
62import pandas as pd
df = pd.read_csv("data/weather.csv")
df["month"] = pd.to_datetime(df["date"]).dt.to_period("M").astype(str) # 将date转换为 年-月 的格式
df_groupby_date = df.groupby("month") # 按month分组,返回一个分组对象(DataFrameGroupBy)
month_temp = df_groupby_date[["temp_max", "temp_min"]] # 从分组对象中选择特定的列
month_temp_mean = month_temp.mean() # 对每个列求平均值
# 以上代码可以写在一起
month_temp_mean = df.groupby("month")[["temp_max", "temp_min"]].mean()
print(month_temp_mean)
# temp_max temp_min
# month
# 2012-01 7.054839 1.541935
# 2012-02 9.275862 3.203448
# 2012-03 9.554839 2.838710
# 2012-04 14.873333 5.993333
# 2012-05 17.661290 8.190323
# 2012-06 18.693333 10.480000
# 2012-07 22.906452 12.932258
# 2012-08 25.858065 14.009677
# 2012-09 22.880000 11.243333
# 2012-10 15.829032 8.380645
# 2012-11 11.326667 5.226667
# 2012-12 7.235484 3.293548
# 2013-01 6.106452 0.796774
# 2013-02 9.467857 4.325000
# 2013-03 12.709677 4.977419
# 2013-04 14.243333 6.696667
# 2013-05 19.625806 9.922581
# 2013-06 23.253333 13.163333
# 2013-07 26.093548 13.932258
# 2013-08 26.119355 15.480645
# 2013-09 21.360000 13.590000
# 2013-10 14.229032 7.638710
# 2013-11 12.053333 5.590000
# 2013-12 7.022581 1.570968
# 2014-01 9.600000 4.096774
# 2014-02 8.200000 2.635714
# 2014-03 12.906452 5.425806
# 2014-04 15.460000 6.730000
# 2014-05 19.870968 10.216129
# 2014-06 21.590000 11.756667
# 2014-07 26.900000 14.425806
# 2014-08 26.383871 14.893548
# 2014-09 23.163333 13.233333
# 2014-10 17.961290 10.883871
# 2014-11 11.030000 4.510000
# 2014-12 10.138710 4.609677
# 2015-01 10.154839 4.351613
# 2015-02 12.517857 6.085714
# 2015-03 14.377419 6.193548
# 2015-04 15.503333 6.030000
# 2015-05 20.025806 10.129032
# 2015-06 26.063333 13.576667
# 2015-07 28.093548 15.500000
# 2015-08 26.087097 14.693548
# 2015-09 20.293333 11.366667
# 2015-10 17.538710 10.500000
# 2015-11 9.683333 3.480000
# 2015-12 8.380645 3.825806分组后默认会将分组字段作为行索引。如果分组字段有多个,得到的是复合索引。
分组频数计算:统计每个月不同天气状况的数量。
1
2
3
4
5
6
7
8
9
10
11
12
13
14
15
16
17
18
19
20
21
22
23
24
25
26
27
28
29
30
31
32
33
34
35
36
37
38
39
40
41
42
43
44
45
46
47
48
49
50
51
52
53
54
55
56import pandas as pd
df = pd.read_csv("data/weather.csv")
df["month"] = pd.to_datetime(df["date"]).dt.to_period("M").astype(str) # 将date转换为 年-月 的格式
print(df.groupby("month")["weather"].nunique())
# month
# 2012-01 4
# 2012-02 4
# 2012-03 4
# 2012-04 4
# 2012-05 3
# 2012-06 3
# 2012-07 4
# 2012-08 3
# 2012-09 4
# 2012-10 3
# 2012-11 4
# 2012-12 4
# 2013-01 4
# 2013-02 3
# 2013-03 5
# 2013-04 4
# 2013-05 3
# 2013-06 2
# 2013-07 2
# 2013-08 3
# 2013-09 3
# 2013-10 3
# 2013-11 4
# 2013-12 3
# 2014-01 3
# 2014-02 3
# 2014-03 3
# 2014-04 2
# 2014-05 2
# 2014-06 2
# 2014-07 3
# 2014-08 3
# 2014-09 3
# 2014-10 3
# 2014-11 4
# 2014-12 3
# 2015-01 3
# 2015-02 3
# 2015-03 3
# 2015-04 3
# 2015-05 3
# 2015-06 4
# 2015-07 4
# 2015-08 4
# 2015-09 3
# 2015-10 4
# 2015-11 3
# 2015-12 3
# Name: weather, dtype: int64
2.5.4 基本绘图
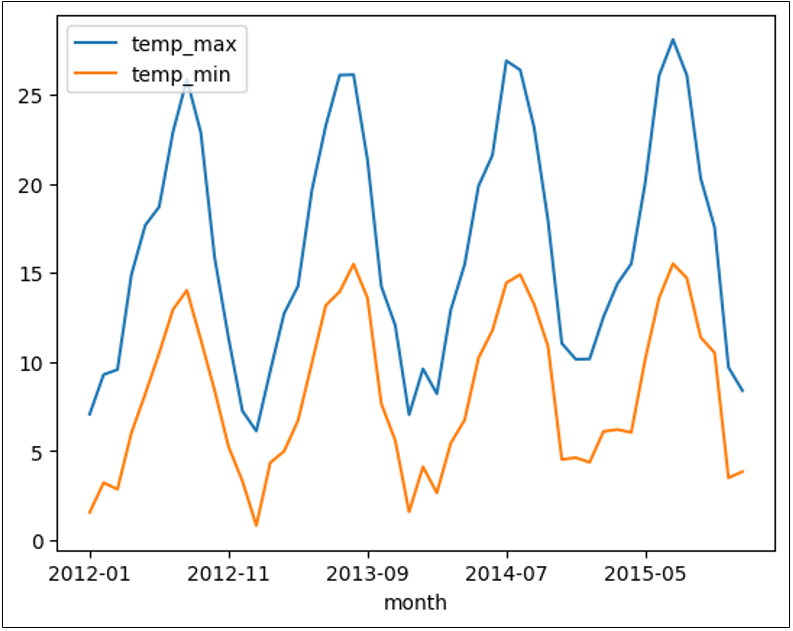
plot():pandas 提供的绘图方法,它基于 matplotlib 库。将前面计算得到的均值结果绘制成图表,默认情况下会绘制折线图,其中 “month” 作为 x 轴,”temp_max” 和 “temp_min” 的均值作为 y 轴。
1
df.groupby("month")[["temp_max", "temp_min"]].mean().plot() # 使用plot绘制折线图
![image-20250628150334694]()
2.5.5 常用统计值
可通过describe()查看常用统计信息。
1
2
3
4
5
6
7
8
9
10
11
12
13
14
15
16
17
18
19
20import pandas as pd
df = pd.read_csv("data/weather.csv")
print(df.describe()) # 查看常用统计信息
# precipitation temp_max temp_min wind
# count 1461.000000 1461.000000 1461.000000 1461.000000
# mean 3.029432 16.439083 8.234771 3.241136
# std 6.680194 7.349758 5.023004 1.437825
# min 0.000000 -1.600000 -7.100000 0.400000
# 25% 0.000000 10.600000 4.400000 2.200000
# 50% 0.000000 15.600000 8.300000 3.000000
# 75% 2.800000 22.200000 12.200000 4.000000
# max 55.900000 35.600000 18.300000 9.500000
print(df.describe().T) # 行列转置
# count mean std min 25% 50% 75% max
# precipitation 1461.0 3.029432 6.680194 0.0 0.0 0.0 2.8 55.9
# temp_max 1461.0 16.439083 7.349758 -1.6 10.6 15.6 22.2 35.6
# temp_min 1461.0 8.234771 5.023004 -7.1 4.4 8.3 12.2 18.3
# wind 1461.0 3.241136 1.437825 0.4 2.2 3.0 4.0 9.5可通过include参数指定要统计哪些数据类型的列。
1
2
3
4
5
6
7
8
9
10
11
12
13
14
15
16
17
18
19
20
21
22
23
24
25
26
27import pandas as pd
df = pd.read_csv("data/weather.csv")
print(df.describe(include="all")) # 统计所有列
# date precipitation temp_max temp_min wind weather
# count 1461 1461.000000 1461.000000 1461.000000 1461.000000 1461
# unique 1461 NaN NaN NaN NaN 5
# top 2012-01-01 NaN NaN NaN NaN rain
# freq 1 NaN NaN NaN NaN 641
# mean NaN 3.029432 16.439083 8.234771 3.241136 NaN
# std NaN 6.680194 7.349758 5.023004 1.437825 NaN
# min NaN 0.000000 -1.600000 -7.100000 0.400000 NaN
# 25% NaN 0.000000 10.600000 4.400000 2.200000 NaN
# 50% NaN 0.000000 15.600000 8.300000 3.000000 NaN
# 75% NaN 2.800000 22.200000 12.200000 4.000000 NaN
# max NaN 55.900000 35.600000 18.300000 9.500000 NaN
print(df.describe(include=["float64"])) # 只统计数据类型为float64的列
# precipitation temp_max temp_min wind
# count 1461.000000 1461.000000 1461.000000 1461.000000
# mean 3.029432 16.439083 8.234771 3.241136
# std 6.680194 7.349758 5.023004 1.437825
# min 0.000000 -1.600000 -7.100000 0.400000
# 25% 0.000000 10.600000 4.400000 2.200000
# 50% 0.000000 15.600000 8.300000 3.000000
# 75% 2.800000 22.200000 12.200000 4.000000
# max 55.900000 35.600000 18.300000 9.500000
2.5.6 常用排序方法
1 | nlargest(n, [列名1, 列名2, …]):按列排序的最大n个 |
找到最高温度最大的30天。
1
2
3
4
5
6
7
8
9
10
11
12
13
14
15
16
17
18
19
20
21
22
23
24
25
26
27
28
29
30
31
32# 通过nlargest()找出temp_max最大的30条数据
date precipitation temp_max temp_min wind weather
953 2014-08-11 0.5 35.6 17.8 2.6 rain
1295 2015-07-19 0.0 35.0 17.2 3.3 sun
228 2012-08-16 0.0 34.4 18.3 2.8 sun
912 2014-07-01 0.0 34.4 15.6 3.5 sun
1306 2015-07-30 0.0 34.4 17.2 3.5 sun
1307 2015-07-31 0.0 34.4 17.8 2.6 sun
216 2012-08-04 0.0 33.9 16.7 3.7 sun
217 2012-08-05 0.0 33.9 17.8 1.9 sun
546 2013-06-30 0.0 33.9 17.2 2.5 sun
619 2013-09-11 0.0 33.9 16.1 2.4 sun
1278 2015-07-02 0.0 33.9 17.8 3.4 sun
1273 2015-06-27 0.0 33.3 17.2 3.9 sun
1279 2015-07-03 0.0 33.3 17.8 2.6 sun
1280 2015-07-04 0.0 33.3 15.0 2.9 sun
1294 2015-07-18 0.0 33.3 17.8 3.4 sun
1308 2015-08-01 0.0 33.3 15.6 3.1 sun
229 2012-08-17 0.0 32.8 16.1 1.8 sun
946 2014-08-04 0.0 32.8 16.1 2.6 sun
1281 2015-07-05 0.0 32.8 16.7 2.1 sun
250 2012-09-07 0.0 32.2 13.3 3.1 sun
923 2014-07-12 0.0 32.2 16.7 2.2 sun
979 2014-09-06 0.0 32.2 15.0 2.9 sun
1277 2015-07-01 0.0 32.2 17.2 4.3 sun
1305 2015-07-29 0.0 32.2 14.4 3.8 sun
547 2013-07-01 0.0 31.7 18.3 2.3 sun
945 2014-08-03 0.0 31.7 14.4 2.6 sun
1272 2015-06-26 0.0 31.7 17.8 4.7 sun
1326 2015-08-19 0.0 31.7 16.1 2.1 drizzle
227 2012-08-15 0.0 31.1 16.7 4.7 sun
562 2013-07-16 0.0 31.1 18.3 4.1 sun从最高温度最大的30天中找出最低温度最小的5天。
1
2
3
4
5
6
7
8
9
10
11# 通过nsmallest()找出temp_min最小的5条数据
import pandas as pd
df = pd.read_csv("data/weather.csv")
print(df.nlargest(30, "temp_max").nsmallest(5, "temp_min"))
# date precipitation temp_max temp_min wind weather
# 250 2012-09-07 0.0 32.2 13.3 3.1 sun
# 1305 2015-07-29 0.0 32.2 14.4 3.8 sun
# 945 2014-08-03 0.0 31.7 14.4 2.6 sun
# 1280 2015-07-04 0.0 33.3 15.0 2.9 sun
# 979 2014-09-06 0.0 32.2 15.0 2.9 sun找出每年的最高温度。
1
2
3
4
5
6
7
8
9
10
11import pandas as pd
df = pd.read_csv("data/weather.csv")
df["year"] = pd.to_datetime(df["date"]).dt.to_period("Y").astype(str) # 将date转换为 年 格式
df_sort = df.sort_values(["year", "temp_max"], ascending=[True, False]) # 按year升序,temp_max降序排序
print(df_sort.drop_duplicates(subset="year")) # 按year去重
# date precipitation temp_max temp_min wind weather year
# 228 2012-08-16 0.0 34.4 18.3 2.8 sun 2012
# 546 2013-06-30 0.0 33.9 17.2 2.5 sun 2013
# 953 2014-08-11 0.5 35.6 17.8 2.6 rain 2014
# 1295 2015-07-19 0.0 35.0 17.2 3.3 sun 20151
2
3
4
5
6
7
8
9
10
11import pandas as pd
df = pd.read_csv("data/weather.csv")
df["year"] = pd.to_datetime(df["date"]).dt.to_period("Y").astype(str) # 将date转换为 年 格式
print(df.groupby("year")[["temp_max"]].max())
# temp_max
# year
# 2012 34.4
# 2013 33.9
# 2014 35.6
# 2015 35.0
2.5.7 案例:简单数据分析练习
使用employees(员工)数据集,其中包含10个字段:
- employee_id:员工id。
- first_name:员工名称。
- last_name:员工姓氏。
- email:员工邮箱。
- phone_number:员工电话号码。
- job_id:员工工种。
- salary:员工薪资。
- commission_pct:员工佣金比例。
- manager_id:员工领导的id。
- department_id:员工的部门id。
1
2
3
4
5
6
7
8
9
10
11
12"employee_id","first_name","last_name","email","phone_number","job_id","salary","commission_pct","manager_id","department_id"
100,Steven,King,SKING,"515.123.4567",AD_PRES,24000.0,,,90
101,N_ann,Kochhar,NKOCHHAR,"515.123.4568",AD_VP,17000.0,,100,90
102,Lex,De Haan,LDEHAAN,"515.123.4569",AD_VP,17000.0,,100,90
103,Alexander,Hunold,AHUNOLD,"590.423.4567",IT_PROG,9000.0,,102,60
104,Bruce,Ernst,BERNST,"590.423.4568",IT_PROG,6000.0,,103,60
105,David,Austin,DAUSTIN,"590.423.4569",IT_PROG,4800.0,,103,60
106,Valli,Pataballa,VPATABAL,"590.423.4560",IT_PROG,4800.0,,103,60
107,Diana,Lorentz,DLORENTZ,"590.423.5567",IT_PROG,4200.0,,103,60
108,Nancy,Greenberg,NGREENBE,"515.124.4569",FI_MGR,12000.0,,101,100
109,Daniel,Faviet,DFAVIET,"515.124.4169",FI_ACCOUNT,9000.0,,108,100
…………加载数据
1
2
3import pandas as pd
df = pd.read_csv("data/employees.csv") # 加载员工数据查看数据
1
2
3
4print(df.head()) # 查看前5行
df.info() # 查看数据信息
print(df.describe()) # 查看统计信息
print(df.shape) # 查看数据形状找出薪资最低、最高的员工
1
2
3
4
5
6print(df[df["salary"] == df["salary"].min()]) # 找出最低薪资的员工
print(df.loc[df["salary"] == df["salary"].min()]) # 找出最低薪资的员工
print(df.loc[df["salary"] == df["salary"].max()]) # 找出最高薪资的员工
print(df.sort_values("salary").head(1)) # 使用排序的方法找出最低薪资的员工
print(df.sort_values("salary", ascending=False).head(1)) # 使用排序的方法找出最高薪资的员工找出薪资最高的10名员工
1
print(df.nlargest(10, "salary")) # 薪资最高的10名员工
查看所有部门id
1
print(df["department_id"].unique()) # 所有部门id
查看每个部门的员工数
1
print(df.groupby("department_id")["employee_id"].count().rename("employee_count")) # 查看每个部门的员工数
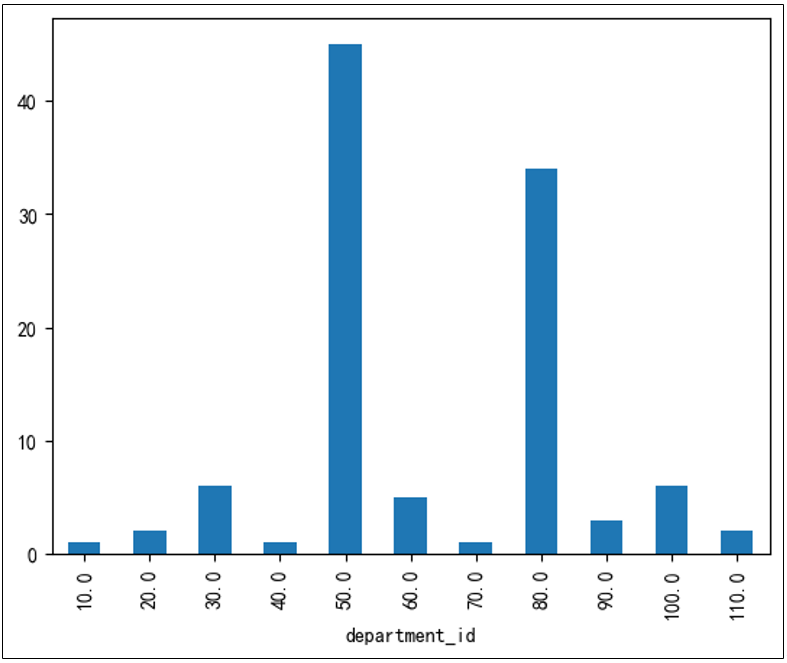
绘图
1
df.groupby("department_id")["employee_id"].count().rename("employee_count").plot(kind="bar")
![image-20250628152627413]()
薪资的分布
1
2
3print(df["salary"].mean()) # 平均值
print(df["salary"].std()) # 标准差
print(df["salary"].median()) # 中位数找出平均薪资最高的部门id
1
print(df.groupby("department_id")["salary"].mean().nlargest(1)) # 平均薪资最高的部门
2.6 Padas的数据组合函数
2.6.1 concat连接
沿着一条轴将多个对象堆叠到一起,可通过axis参数设置沿哪一条轴连接。
Series与Series连接
1
2
3
4
5
6
7
8
9
10
11
12
13
14
15
16
17
18
19
20
21
22
23
24
25
26
27
28
29
30
31
32
33
34
35
36
37import pandas as pd
s1 = pd.Series(["A", "B"], index=[1, 2])
print(s1)
# 1 A
# 2 B
# dtype: object
s2 = pd.Series(["D", "E"], index=[4, 5])
print(s2)
# 4 D
# 5 E
# dtype: object
s3 = pd.Series(["G", "H"], index=[7, 8])
print(s3)
# 7 G
# 8 H
# dtype: object
print(pd.concat([s1, s2, s3])) # 按行连接
# 1 A
# 2 B
# 4 D
# 5 E
# 7 G
# 8 H
# dtype: object
print(pd.concat([s1, s2, s3], axis=1)) # 按列连接
# 0 1 2
# 1 A NaN NaN
# 2 B NaN NaN
# 4 NaN D NaN
# 5 NaN E NaN
# 7 NaN NaN G
# 8 NaN NaN H缺失值会用NaN填充。
DataFrame与Series连接
1
2
3
4
5
6
7
8
9
10
11
12
13
14
15
16
17
18
19
20
21
22
23
24
25import pandas as pd
df1 = pd.DataFrame(data={"a": [1, 2], "b": [4, 5]}, index=[1, 2])
print(df1)
# a b
# 1 1 4
# 2 2 5
s1 = pd.Series(data=[7, 10], index=[1, 2], name="a")
print(s1)
# 1 7
# 2 10
# Name: a, dtype: int64
print(pd.concat([df1, s1])) # 按行连接
# a b
# 1 1 4.0
# 2 2 5.0
# 1 7 NaN
# 2 10 NaN
print(pd.concat([df1, s1], axis=1)) # 按列连接
# a b a
# 1 1 4 7
# 2 2 5 10DataFrame与DataFrame连接
1
2
3
4
5
6
7
8
9
10
11
12
13
14
15
16
17
18
19
20
21
22
23
24
25import pandas as pd
df1 = pd.DataFrame(data={"a": [1, 2], "b": [4, 5]}, index=[1, 2])
print(df1)
# a b
# 1 1 4
# 2 2 5
df2 = pd.DataFrame(data={"a": [7, 8], "b": [10, 11]}, index=[1, 2])
print(df2)
# a b
# 1 7 10
# 2 8 11
print(pd.concat([df1, df2])) # 按行连接
# a b
# 1 1 4
# 2 2 5
# 1 7 10
# 2 8 11
print(pd.concat([df1, df2], axis=1)) # 按列连接
# a b a b
# 1 1 4 7 10
# 2 2 5 8 11重置索引:可通过ignore_index=True来重置索引。
1
2
3
4
5
6
7
8
9
10
11
12
13
14
15
16
17
18
19
20
21
22
23
24
25
26
27import pandas as pd
df1 = pd.DataFrame(data={"a": [1, 2], "b": [4, 5]}, index=[1, 2])
print(df1)
# a b
# 1 1 4
# 2 2 5
df2 = pd.DataFrame(data={"a": [7, 8], "b": [10, 11]}, index=[1, 2])
print(df2)
# a b
# 1 7 10
# 2 8 11
print(pd.concat([df1, df2]))
# a b
# 1 1 4
# 2 2 5
# 1 7 10
# 2 8 11
print(pd.concat([df1, df2], ignore_index=True)) # 重置索引
# a b
# 0 1 4
# 1 2 5
# 2 7 10
# 3 8 11类似join的连接:默认的合并方式是对其他轴进行并集合并(join=outer),可以用join=inner实现其他轴上的交集合并。
1
2
3
4
5
6
7
8
9
10
11
12
13
14
15
16
17
18
19
20
21
22
23
24
25
26
27import pandas as pd
df1 = pd.DataFrame(data={"a": [1, 2], "b": [4, 5]}, index=[1, 2])
print(df1)
# a b
# 1 1 4
# 2 2 5
df2 = pd.DataFrame(data={"b": [7, 8], "c": [10, 11]}, index=[2, 3])
print(df2)
# b c
# 2 7 10
# 3 8 11
print(pd.concat([df1, df2]))
# a b c
# 1 1.0 4 NaN
# 2 2.0 5 NaN
# 2 NaN 7 10.0
# 3 NaN 8 11.0
print(pd.concat([df1, df2], join="inner"))
# b
# 1 4
# 2 5
# 2 7
# 3 8
2.6.2 merge合并
通过一个或多个列将行连接。
数据连接的类型:merge()实现了三种数据连接的类型:一对一、多对一和多对多。
一对一连接
1
2
3
4
5
6
7
8
9
10
11
12
13
14
15
16
17
18
19
20
21
22
23
24
25
26
27
28import pandas as pd
df1 = pd.DataFrame(
{"employee": ["Bob", "Jake", "Lisa", "Sue"], "group": ["Accounting", "Engineering", "Engineering", "HR"]}
)
df2 = pd.DataFrame({"employee": ["Lisa", "Bob", "Jake", "Sue"], "hire_date": [2004, 2008, 2012, 2014]})
print(df1)
# employee group
# 0 Bob Accounting
# 1 Jake Engineering
# 2 Lisa Engineering
# 3 Sue HR
print(df2)
# employee hire_date
# 0 Lisa 2004
# 1 Bob 2008
# 2 Jake 2012
# 3 Sue 2014
# 通过相同的字段名employee进行关联的
df3 = pd.merge(df1, df2)
print(df3)
# employee group hire_date
# 0 Bob Accounting 2008
# 1 Jake Engineering 2012
# 2 Lisa Engineering 2004
# 3 Sue HR 2014多对一连接:在需要连接的两个列中,有一列的值有重复。通过多对一连接获得的结果将会保留重复值。
1
2
3
4
5
6
7
8
9
10
11
12
13
14
15
16
17
18
19
20
21
22df1 = pd.DataFrame(
{"employee": ["Bob", "Jake", "Lisa", "Sue"], "group": ["Accounting", "Engineering", "Engineering", "HR"]}
)
df2 = pd.DataFrame({"group": ["Accounting", "Engineering", "HR"], "supervisor": ["Carly", "Guido", "Steve"]})
print(df1)
# employee group
# 0 Bob Accounting
# 1 Jake Engineering
# 2 Lisa Engineering
# 3 Sue HR
print(df2)
# group supervisor
# 0 Accounting Carly
# 1 Engineering Guido
# 2 HR Steve
df3 = pd.merge(df1, df2)
print(df3)
# employee group supervisor
# 0 Bob Accounting Carly
# 1 Jake Engineering Guido
# 2 Lisa Engineering Guido
# 3 Sue HR Steve在supervisor列中有些值会因为输入数据的对应关系而有所重复。
多对多连接:如果左右两个输入的共同列都包含重复值,那么合并的结果就是一种多对多连接。
1
2
3
4
5
6
7
8
9
10
11
12
13
14
15
16
17
18
19
20
21
22
23
24
25
26
27
28
29
30
31
32
33
34df1 = pd.DataFrame(
{"employee": ["Bob", "Jake", "Lisa", "Sue"], "group": ["Accounting", "Engineering", "Engineering", "HR"]}
)
df2 = pd.DataFrame(
{
"group": ["Accounting", "Accounting", "Engineering", "Engineering", "HR", "HR"],
"skills": ["math", "spreadsheets", "coding", "linux", "spreadsheets", "organization"],
}
)
print(df1)
# employee group
# 0 Bob Accounting
# 1 Jake Engineering
# 2 Lisa Engineering
# 3 Sue HR
print(df2)
# group skills
# 0 Accounting math
# 1 Accounting spreadsheets
# 2 Engineering coding
# 3 Engineering linux
# 4 HR spreadsheets
# 5 HR organization
df3 = pd.merge(df1, df2)
print(df3)
# employee group skills
# 0 Bob Accounting math
# 1 Bob Accounting spreadsheets
# 2 Jake Engineering coding
# 3 Jake Engineering linux
# 4 Lisa Engineering coding
# 5 Lisa Engineering linux
# 6 Sue HR spreadsheets
# 7 Sue HR organization多对多连接产生的是行的笛卡尔积。由于左边有2个Engineering,右边有2个Engineering,所以最终结果有4个Engineering。
设置合并的键与索引:merge()会将两个输入的一个或多个共同列作为键进行合并。但由于两个输入要合并的列通常都不是同名的,因此merge()提供了一些参数处理这个问题。
通过on指定使用某个列连接,只能在有共同列名的时候使用。
1
2
3
4
5
6
7
8
9
10
11
12
13
14
15
16
17
18
19
20
21
22
23df1 = pd.DataFrame(
{"employee": ["Bob", "Jake", "Lisa", "Sue"], "group": ["Accounting", "Engineering", "Engineering", "HR"]}
)
df2 = pd.DataFrame({"employee": ["Lisa", "Bob", "Jake", "Sue"], "hire_date": [2004, 2008, 2012, 2014]})
print(df1)
# employee group
# 0 Bob Accounting
# 1 Jake Engineering
# 2 Lisa Engineering
# 3 Sue HR
print(df2)
# employee hire_date
# 0 Lisa 2004
# 1 Bob 2008
# 2 Jake 2012
# 3 Sue 2014
df3 = pd.merge(df1, df2, on="employee")
print(df3)
# employee group hire_date
# 0 Bob Accounting 2008
# 1 Jake Engineering 2012
# 2 Lisa Engineering 2004
# 3 Sue HR 2014两对象列名不同,通过left_on和right_on分别指定列名。
1
2
3
4
5
6
7
8
9
10
11
12
13
14
15
16
17
18
19
20
21
22
23df1 = pd.DataFrame(
{"employee": ["Bob", "Jake", "Lisa", "Sue"], "group": ["Accounting", "Engineering", "Engineering", "HR"]}
)
df2 = pd.DataFrame({"name": ["Bob", "Jake", "Lisa", "Sue"], "salary": [70000, 80000, 120000, 90000]})
print(df1)
# employee group
# 0 Bob Accounting
# 1 Jake Engineering
# 2 Lisa Engineering
# 3 Sue HR
print(df2)
# name salary
# 0 Bob 70000
# 1 Jake 80000
# 2 Lisa 120000
# 3 Sue 90000
df3 = pd.merge(df1, df2, left_on="employee", right_on="name")
print(df3)
# employee group name salary
# 0 Bob Accounting Bob 70000
# 1 Jake Engineering Jake 80000
# 2 Lisa Engineering Lisa 120000
# 3 Sue HR Sue 90000通过left_index和right_index设置合并的索引:通过设置merge()中的left_index、right_index参数将索引设置为键来实现合并。
1
2
3
4
5
6
7
8
9
10
11
12
13
14
15
16
17
18
19
20
21
22
23
24
25
26
27
28df1 = pd.DataFrame(
{"employee": ["Bob", "Jake", "Lisa", "Sue"], "group": ["Accounting", "Engineering", "Engineering", "HR"]}
)
df2 = pd.DataFrame({"employee": ["Lisa", "Bob", "Jake", "Sue"], "hire_date": [2004, 2008, 2012, 2014]})
df1.set_index("employee", inplace=True)
df2.set_index("employee", inplace=True)
print(df1)
# group
# employee
# Bob Accounting
# Jake Engineering
# Lisa Engineering
# Sue HR
print(df2)
# hire_date
# employee
# Lisa 2004
# Bob 2008
# Jake 2012
# Sue 2014
# 设置索引后,如果不指定关联列会报错,建议通过以下方式指定,on="employee"也可#以实现,但是不同的解释器可能效果不一样,因为设置索引后,employee就不算是列了
df3 = pd.merge(df1, df2, left_index=True, right_index=True)
# group hire_date
# employee
# Bob Accounting 2008
# Jake Engineering 2012
# Lisa Engineering 2004
# Sue HR 2014DataFrame实现了join()方法,可以按照索引进行数据合并。但要求没有重叠的列,或通过lsuffix、rsuffix指定重叠列的后缀。
1
2
3
4
5
6
7
8
9
10
11
12
13
14
15
16
17
18
19
20
21
22
23
24
25
26
27
28import pandas as pd
df1 = pd.DataFrame({
'key': ['A', 'B', 'C'],
'value1': [1, 2, 3]
})
print(df1)
# key value1
# 0 A 1
# 1 B 2
# 2 C 3
df2 = pd.DataFrame({
'key': ['B', 'C', 'D'],
'value2': [4, 5, 6]
})
print(df2)
# key value2
# 0 B 4
# 1 C 5
# 2 D 6
# 合并两个 DataFrame,并处理列名冲突
print(df1.join(df2,lsuffix='_left',rsuffix='_right'))
# key_left value1 key_right value2
# 0 A 1 B 4
# 1 B 2 C 5
# 2 C 3 D 6
设置数据连接的集合操作规则:当一个值出现在一列,却没有出现在另一列时,就需要考虑集合操作规则了。
1
2
3
4
5
6
7
8
9
10
11
12
13
14df1 = pd.DataFrame({"name": ["Peter", "Paul", "Mary"], "food": ["fish", "beans", "bread"]}, columns=["name", "food"])
df2 = pd.DataFrame({"name": ["Mary", "Joseph"], "drink": ["wine", "beer"]}, columns=["name", "drink"])
print(df1)
# name food
# 0 Peter fish
# 1 Paul beans
# 2 Mary bread
print(df2)
# name drink
# 0 Mary wine
# 1 Joseph beer
print(pd.merge(df1, df2))
# name food drink
# 0 Mary bread wine合并两个数据集,在name列中只有一个共同的值Mary。默认情况下,结果中只会包含两个输入集合的交集,这种连接方式被称为内连接(inner join)。
我们可以通过how参数设置连接方式,默认值为inner。how参数支持的数据连接方式还有outer、left和right。外连接(outer join)返回两个输入列的并集,所有缺失值都用 NaN 填充。
1
2
3
4
5
6print(pd.merge(df1, df2, how="outer"))
# name food drink
# 0 Joseph NaN beer
# 1 Mary bread wine
# 2 Paul beans NaN
# 3 Peter fish NaN左连接(left join)和右连接(right join)返回的结果分别只包含左列和右列。
1
2
3
4
5print(pd.merge(df1, df2, how="left"))
# name food drink
# 0 Peter fish NaN
# 1 Paul beans NaN
# 2 Mary bread wine重复列名的处理:可能会遇到两个输入DataFrame有重名列的情况,merge()会自动为其增加后缀_x和_y,也可以通过suffixes参数自定义后缀名。
1
2
3
4
5
6
7
8
9
10
11
12
13
14
15
16
17
18
19
20
21
22
23
24
25
26df1 = pd.DataFrame({"name": ["Bob", "Jake", "Lisa", "Sue"], "rank": [1, 2, 3, 4]})
df2 = pd.DataFrame({"name": ["Bob", "Jake", "Lisa", "Sue"], "rank": [3, 1, 4, 2]})
print(df1)
# name rank
# 0 Bob 1
# 1 Jake 2
# 2 Lisa 3
# 3 Sue 4
print(df2)
# name rank
# 0 Bob 3
# 1 Jake 1
# 2 Lisa 4
# 3 Sue 2
print(pd.merge(df1, df2, on="name")) # 不指定后缀名,默认为_x和_y
# name rank_x rank_y
# 0 Bob 1 3
# 1 Jake 2 1
# 2 Lisa 3 4
# 3 Sue 4 2
print(pd.merge(df1, df2, on="name", suffixes=("_df1", "_df2"))) # 通过suffixes指定后缀名
# name rank_df1 rank_df2
# 0 Bob 1 3
# 1 Jake 2 1
# 2 Lisa 3 4
# 3 Sue 4 2
2.7 Padas的缺失值处理函数
2.7.1 pandas中的缺失值
pandas使用浮点值NaN(Not a Number)表示缺失数据,使用NA(Not Available)表示缺失值。可以通过isnull()、isna()或notnull()、notna()方法判断某个值是否为缺失值。
Nan通常表示一个无效的或未定义的数字值,是浮点数的一种特殊取值,用于表示那些不能表示为正常数字的情况,如 0/0、∞-∞等数学运算的结果。nan与任何值(包括它自身)进行比较的结果都为False。例如在 Python 中,nan == nan返回False。
NA一般用于表示数据不可用或缺失的情况,它的含义更侧重于数据在某种上下文中是缺失或不存在的,不一定特指数字类型的缺失。
na和nan都用于表示缺失值,但nan更强调是数值计算中的特殊值,而na更强调数据的可用性或存在性。
1
2
3
4
5
6
7
8
9
10
11s = pd.Series([np.nan, None, pd.NA])
print(s)
# 0 NaN
# 1 None
# 2 <NA>
# dtype: object
print(s.isnull())
# 0 True
# 1 True
# 2 True
# dtype: bool
2.7.2 加载数据中包含缺失值
1 | df = pd.read_csv("data/weather_withna.csv") |
可以通过keep_default_na参数设置是否将空白值设置为缺失值。
1
2
3
4
5
6
7
8df = pd.read_csv("data/weather_withna.csv", keep_default_na=False)
print(df.tail(5))
# date precipitation temp_max temp_min wind weather
# 1456 2015-12-27
# 1457 2015-12-28
# 1458 2015-12-29
# 1459 2015-12-30
# 1460 2015-12-31 20.6 12.2 5.0 3.8 rain可通过na_values参数将指定值设置为缺失值。
1
2
3
4
5
6
7
8df = pd.read_csv("data/weather_withna.csv", na_values=["2015-12-31"])
print(df.tail(5))
# date precipitation temp_max temp_min wind weather
# 1456 2015-12-27 NaN NaN NaN NaN NaN
# 1457 2015-12-28 NaN NaN NaN NaN NaN
# 1458 2015-12-29 NaN NaN NaN NaN NaN
# 1459 2015-12-30 NaN NaN NaN NaN NaN
# 1460 NaN 20.6 12.2 5.0 3.8 rain
2.7.3 查看缺失值
通过isnull()查看缺失值数量
1
2
3
4
5
6
7
8
9df = pd.read_csv("data/weather_withna.csv")
print(df.isnull().sum())
# date 0
# precipitation 303
# temp_max 303
# temp_min 303
# wind 303
# weather 303
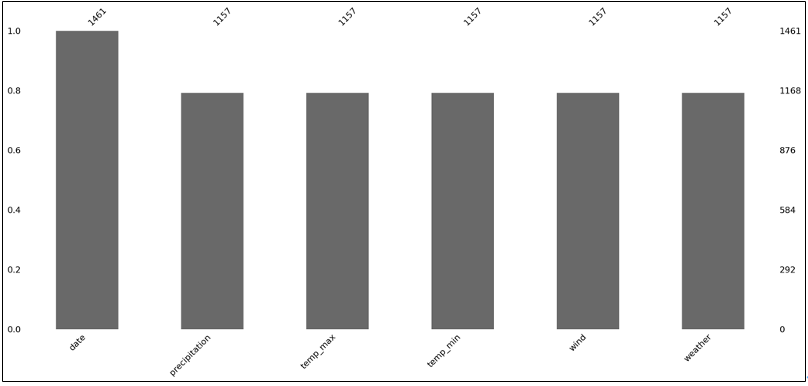
# dtype: int64通过missingno条形图展示缺失值(先安装missingno包:pip install missingno)
1
2
3
4
5import missingno as msno
import pandas as pd
df = pd.read_csv("data/weather_withna.csv")
msno.bar(df)![image-20250628175157241]()
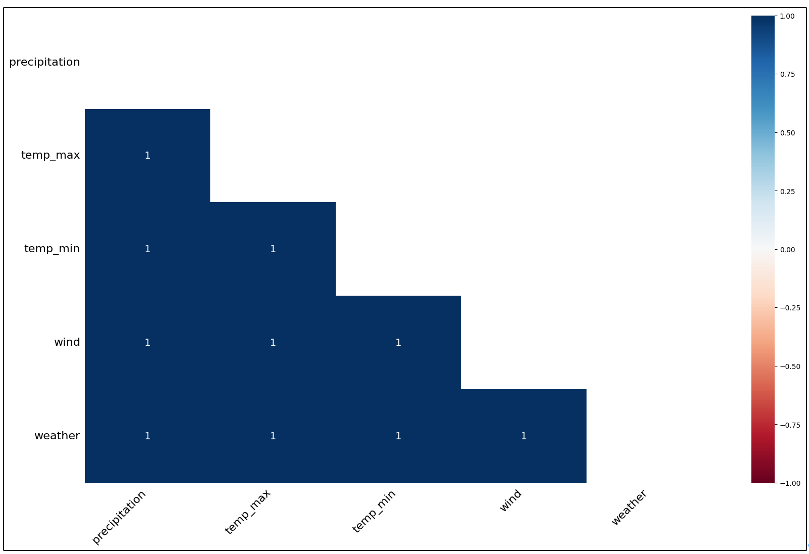
通过热力图查看缺失值的相关性。missingno绘制的热力图能够展示数据集中不同列的缺失值之间的相关性。这里的相关性体现的是当某一列出现缺失值时,其他列出现缺失值的可能性。如果两个列的缺失值呈现正相关,意味着当其中一列有缺失值时,另一列也很可能有缺失值;若为负相关,则表示当一列有缺失值时,另一列更倾向于没有缺失值。
- 颜色与数值:热力图中的颜色和数值反映了列之间缺失值的相关性。接近 1 表示正相关,接近 -1 表示负相关,接近 0 则表示缺失值之间没有明显的关联。
- 示例说明:假如 A 列和 B 列在热力图中对应区域颜色较深且数值接近 1,这就表明当 A 列出现缺失值时,B 列也很可能出现缺失值;若数值接近 -1,情况则相反。
1
msno.heatmap(df)
![image-20250628180402415]()
2.7.4 剔除缺失值
通过dropna()方法来剔除缺失值。
Series剔除缺失值
1
2
3
4
5
6
7
8
9s = pd.Series([1, pd.NA, None])
print(s)
# 0 1
# 1 <NA>
# 2 None
# dtype: object
print(s.dropna())
# 0 1
# dtype: objectDataFrame剔除缺失值
无法从DataFrame中单独剔除一个值,只能剔除缺失值所在的整行或整列。默认情况下,dropna()会剔除任何包含缺失值的整行数据。
1
2
3
4
5
6
7
8
9df = pd.DataFrame([[1, pd.NA, 2], [2, 3, 5], [pd.NA, 4, 6]])
print(df)
# 0 1 2
# 0 1 <NA> 2
# 1 2 3 5
# 2 <NA> 4 6
print(df.dropna())
# 0 1 2
# 1 2 3 5可以设置按不同的坐标轴剔除缺失值,比如axis=1(或 axis=’columns’)会剔除任何包含缺失值的整列数据。
1
2
3
4
5
6
7
8
9
10
11df = pd.DataFrame([[1, pd.NA, 2], [2, 3, 5], [pd.NA, 4, 6]])
print(df)
# 0 1 2
# 0 1 <NA> 2
# 1 2 3 5
# 2 <NA> 4 6
print(df.dropna(axis=1))
# 2
# 0 2
# 1 5
# 2 6有时只需要剔除全部是缺失值的行或列,或者绝大多数是缺失值的行或列。这些需求可以通过设置how或thresh参数来满足,它们可以设置剔除行或列缺失值的数量阈值。
1
2
3
4
5
6
7
8
9
10
11
12
13df = pd.DataFrame([[1, pd.NA, 2], [pd.NA, pd.NA, 5], [pd.NA, pd.NA, pd.NA]])
print(df)
# 0 1 2
# 0 1 <NA> 2
# 1 <NA> <NA> 5
# 2 <NA> <NA> <NA>
print(df.dropna(how="all")) # 如果所有值都是缺失值,则删除这一行
# 0 1 2
# 0 1 <NA> 2
# 1 <NA> <NA> 5
print(df.dropna(thresh=2)) # 如果至少有2个值不是缺失值,则保留这一行
# 0 1 2
# 0 1 <NA> 2可以通过设置subset参数来设置某一列有缺失值则进行剔除。
1
2
3
4
5
6
7
8
9df = pd.DataFrame([[1, pd.NA, 2], [pd.NA, pd.NA, 5], [pd.NA, pd.NA, pd.NA]])
print(df)
# 0 1 2
# 0 1 <NA> 2
# 1 <NA> <NA> 5
# 2 <NA> <NA> <NA>
print(df.dropna(subset=[0])) # 如果0列有缺失值,则删除这一行
# 0 1 2
# 0 1 <NA> 2
2.7.5 填充缺失值
使用固定值填充。通过fillna()方法,传入值或字典进行填充。
1
2
3
4
5
6
7
8
9
10
11
12
13
14
15df = pd.read_csv("data/weather_withna.csv")
print(df.fillna(0).tail()) # 使用固定值填充
# date precipitation temp_max temp_min wind weather
# 1456 2015-12-27 0.0 0.0 0.0 0.0 0
# 1457 2015-12-28 0.0 0.0 0.0 0.0 0
# 1458 2015-12-29 0.0 0.0 0.0 0.0 0
# 1459 2015-12-30 0.0 0.0 0.0 0.0 0
# 1460 2015-12-31 20.6 12.2 5.0 3.8 rain
print(df.fillna({"temp_max": 60, "temp_min": -60}).tail()) # 使用字典来填充
# date precipitation temp_max temp_min wind weather
# 1456 2015-12-27 NaN 60.0 -60.0 NaN NaN
# 1457 2015-12-28 NaN 60.0 -60.0 NaN NaN
# 1458 2015-12-29 NaN 60.0 -60.0 NaN NaN
# 1459 2015-12-30 NaN 60.0 -60.0 NaN NaN
# 1460 2015-12-31 20.6 12.2 5.0 3.8 rain使用统计值填充。通过fillna()方法,传入统计后的值进行填充。
1
2
3
4
5
6
7print(df.fillna(df[["precipitation", "temp_max", "temp_min", "wind"]].mean()).tail()) # 使用平均值填充
# date precipitation temp_max temp_min wind weather
# 1456 2015-12-27 3.052332 15.851468 7.877202 3.242055 NaN
# 1457 2015-12-28 3.052332 15.851468 7.877202 3.242055 NaN
# 1458 2015-12-29 3.052332 15.851468 7.877202 3.242055 NaN
# 1459 2015-12-30 3.052332 15.851468 7.877202 3.242055 NaN
# 1460 2015-12-31 20.600000 12.200000 5.000000 3.800000 rain使用前后的有效值填充。通过ffill()或bfill()方法使用前面或后面的有效值填充。
1
2
3
4
5
6
7
8
9
10
11
12
13
14print(df.ffill().tail()) # 使用前面的有效值填充
# date precipitation temp_max temp_min wind weather
# 1456 2015-12-27 0.0 11.1 4.4 4.8 sun
# 1457 2015-12-28 0.0 11.1 4.4 4.8 sun
# 1458 2015-12-29 0.0 11.1 4.4 4.8 sun
# 1459 2015-12-30 0.0 11.1 4.4 4.8 sun
# 1460 2015-12-31 20.6 12.2 5.0 3.8 rain
print(df.bfill().tail()) # 使用后面的有效值填充
# date precipitation temp_max temp_min wind weather
# 1456 2015-12-27 20.6 12.2 5.0 3.8 rain
# 1457 2015-12-28 20.6 12.2 5.0 3.8 rain
# 1458 2015-12-29 20.6 12.2 5.0 3.8 rain
# 1459 2015-12-30 20.6 12.2 5.0 3.8 rain
# 1460 2015-12-31 20.6 12.2 5.0 3.8 rain通过线性插值填充。通过interpolate()方法进行线性插值填充。线性插值操作,就是用于在已知数据点之间估算未知数据点的值。interpolate 方法支持多种插值方法,可通过 method 参数指定,常见的方法有:
- ‘linear’:线性插值,基于两点之间的直线来估算缺失值,适用于数据呈线性变化的情况。
- ‘time’:适用于时间序列数据,会考虑时间间隔进行插值。
- ‘polynomial’:多项式插值,通过拟合多项式曲线来估算缺失值,可通过 order 参数指定多项式的阶数。
1
2
3
4
5
6
7
8
9
10
11
12
13
14
15
16import pandas as pd
import numpy as np
# 创建包含缺失值的 Series
s = pd.Series([1, np.nan, 3, 4, np.nan, 6])
# 使用默认的线性插值方法填充缺失值
s_interpolated = s.interpolate()
print(s_interpolated)
# 0 1.0
# 1 2.0
# 2 3.0
# 3 4.0
# 4 5.0
# 5 6.0
# dtype: float64
2.8 Padas的apply函数
- apply()函数可以对DataFrame或Series的数据进行逐行、逐列或逐元素的操作。可以使用自定义函数对数据进行变换、计算或处理,通常用于处理复杂的变换逻辑,或者处理不能通过向量化操作轻松完成的任务。
2.8.1 Series使用apply()
案例一
1 | import pandas as pd |
案例二
1 | def f(x): |
也可以传入lambda表达式。
1
2
3
4
5
6df = pd.DataFrame({"a": [10, 20, 30], "b": [40, 50, 60]})
print(df["a"].apply(lambda x: x * 10))
# 0 100
# 1 200
# 2 300
# Name: a, dtype: int64传入带参数的函数。
1
2
3
4
5
6
7
8
9def f(x, y=10):
return x * y
df = pd.DataFrame({"a": [10, 20, 30], "b": [40, 50, 60]})
print(df["a"].apply(f, y=5))
# 0 50
# 1 100
# 2 150
# Name: a, dtype: int64
2.8.2 DataFrame使用apply()
1 | # 定义一个对DataFrame的处理函数, 接收的参数是一个Series对象 |
默认axis=0,按行方向进行操作,对列进行统计;可以设置axis=1,按照列的方向进行操作,参数设置按行处理。
1
2
3
4
5
6
7
8
9
10
11
12
13
14
15
16
17
18
19
20
21
22import pandas as pd
def sum(s):
return s.sum()
df = pd.DataFrame({"a": [10, 20, 30], "b": [40, 50, 60]})
print(df)
# a b
# 0 10 40
# 1 20 50
# 2 30 60
print(df.apply(sum, axis=0))
# a 60
# b 150
# dtype: int64
print(df.apply(sum, axis=1))
# 0 50
# 1 70
# 2 90
# dtype: int641
2
3
4
5
6
7
8
9
10
11
12
13
14
15
16
17
18
19
20
21
22
23
24
25import pandas as pd
def f1(x):
return x[0] / x[1]
def f2(x):
return x["a"] / x["b"]
df = pd.DataFrame({"a": [10, 20, 30], "b": [40, 50, 60]})
print(df)
# a b
# 0 10 40
# 1 20 50
# 2 30 60
print(df.apply(f1, axis=0))
# a 0.5
# b 0.8
# dtype: float64
print(df.apply(f2, axis=1))
# 0 0.25
# 1 0.40
# 2 0.50
# dtype: float64注意:df.apply 一次只能处理一个 Series(当 axis=0 时处理列,当 axis=1 时处理行),而你定义的函数 f 接收两个参数,不能直接使用 df.apply(f)。
2.8.3 向量化函数
1 | import pandas as pd |
上述代码会报错,因为y==0中,y为向量而0为标量。
可以通过np.vectorize()将函数向量化来进行计算。
1
2
3
4
5
6
7
8
9
10
11
12import pandas as pd
import numpy as np
def f(x, y):
if y == 0:
return np.nan
return x / y
df = pd.DataFrame({"a": [10, 20, 30], "b": [40, 0, 60]})
f_vec = np.vectorize(f)
print(f_vec(df["a"], df["b"]))
# [0.25 nan 0.5 ]也可以使用@np.vectorize装饰器将函数向量化。
1
2
3
4
5
6
7
8
9
10
11import pandas as pd
import numpy as np
def f(x, y):
if y == 0:
return np.nan
return x / y
df = pd.DataFrame({"a": [10, 20, 30], "b": [40, 0, 60]})
print(f(df["a"], df["b"])) # [0.25 nan 0.5 ]
2.9 Padas的数据聚合、转换、过滤函数
2.9.1 DataFrameGroupBy对象
对DataFrame对象调用groupby()方法后,会返回DataFrameGroupBy对象。
1
2
3
4
5import pandas as pd
df = pd.read_csv("data/employees.csv") # 读取员工数据
print(df.groupby("department_id")) # 按department_id分组,返回DataFrameGroupBy对象
# <pandas.core.groupby.generic.DataFrameGroupBy object at 0x1058dbdd0>这个对象可以看成是一种特殊形式的 DataFrame,里面隐藏着若干组数据,但是在没有应用累计函数之前不会计算。GroupBy对象是一种非常灵活的抽象类型。在大多数场景中,可以将它看成是DataFrame的集合。
查看分组。
通过groups属性查看分组结果,返回一个字典,字典的键是分组的标签,值是属于该组的所有索引的列表。
1
2
3
4
5
6import pandas as pd
df = pd.read_csv("data/employees.csv") # 读取员工数据
print(df.groupby("department_id").groups) # 查看分组结果
# 字典,key是department_id,value是属于该部门的所有索引的列表
# {10.0: [100], 20.0: [101, 102], 30.0: [14, 15, 16, 17, 18, 19], 40.0: [103], 50.0: [20, 21, 22, 23, 24, 25, 26, 27, 28, 29, 30, 31, 32, 33, 34, 35, 36, 37, 38, 39, 40, 41, 42, 43, 44, 80, 81, 82, 83, 84, 85, 86, 87, 88, 89, 90, 91, 92, 93, 94, 95, 96, 97, 98, 99], 60.0: [3, 4, 5, 6, 7], 70.0: [104], 80.0: [45, 46, 47, 48, 49, 50, 51, 52, 53, 54, 55, 56, 57, 58, 59, 60, 61, 62, 63, 64, 65, 66, 67, 68, 69, 70, 71, 72, 73, 74, 75, 76, 77, 79], 90.0: [0, 1, 2], 100.0: [8, 9, 10, 11, 12, 13], 110.0: [105, 106]}通过get_group()方法获取分组。
1
2
3
4
5
6
7
8
9
10
11
12
13
14
15
16
17
18
19
20
21
22
23
24
25
26
27
28
29
30
31
32
33
34
35
36
37
38
39
40
41
42
43
44
45
46
47
48
49
50
51
52import pandas as pd
df = pd.read_csv("data/employees.csv") # 读取员工数据
print(df.groupby("department_id").get_group(50)) # 获取分组为department_id=50的数据
# employee_id first_name last_name email ... salary commission_pct manager_id department_id
# 20 120 Matthew Weiss MWEISS ... 8000.0 NaN 100.0 50.0
# 21 121 Adam Fripp AFRIPP ... 8200.0 NaN 100.0 50.0
# 22 122 Payam Kaufling PKAUFLIN ... 7900.0 NaN 100.0 50.0
# 23 123 Shanta Vollman SVOLLMAN ... 6500.0 NaN 100.0 50.0
# 24 124 Kevin Mourgos KMOURGOS ... 5800.0 NaN 100.0 50.0
# 25 125 Julia Nayer JNAYER ... 3200.0 NaN 120.0 50.0
# 26 126 Irene Mikkilineni IMIKKILI ... 2700.0 NaN 120.0 50.0
# 27 127 James Landry JLANDRY ... 2400.0 NaN 120.0 50.0
# 28 128 Steven Markle SMARKLE ... 2200.0 NaN 120.0 50.0
# 29 129 Laura Bissot LBISSOT ... 3300.0 NaN 121.0 50.0
# 30 130 Mozhe Atkinson MATKINSO ... 2800.0 NaN 121.0 50.0
# 31 131 James Marlow JAMRLOW ... 2500.0 NaN 121.0 50.0
# 32 132 TJ Olson TJOLSON ... 2100.0 NaN 121.0 50.0
# 33 133 Jason Mallin JMALLIN ... 3300.0 NaN 122.0 50.0
# 34 134 Michael Rogers MROGERS ... 2900.0 NaN 122.0 50.0
# 35 135 Ki Gee KGEE ... 2400.0 NaN 122.0 50.0
# 36 136 Hazel Philtanker HPHILTAN ... 2200.0 NaN 122.0 50.0
# 37 137 Renske Ladwig RLADWIG ... 3600.0 NaN 123.0 50.0
# 38 138 Stephen Stiles SSTILES ... 3200.0 NaN 123.0 50.0
# 39 139 John Seo JSEO ... 2700.0 NaN 123.0 50.0
# 40 140 Joshua Patel JPATEL ... 2500.0 NaN 123.0 50.0
# 41 141 Trenna Rajs TRAJS ... 3500.0 NaN 124.0 50.0
# 42 142 Curtis Davies CDAVIES ... 3100.0 NaN 124.0 50.0
# 43 143 Randall Matos RMATOS ... 2600.0 NaN 124.0 50.0
# 44 144 Peter Vargas PVARGAS ... 2500.0 NaN 124.0 50.0
# 80 180 Winston Taylor WTAYLOR ... 3200.0 NaN 120.0 50.0
# 81 181 Jean Fleaur JFLEAUR ... 3100.0 NaN 120.0 50.0
# 82 182 Martha Sullivan MSULLIVA ... 2500.0 NaN 120.0 50.0
# 83 183 Girard Geoni GGEONI ... 2800.0 NaN 120.0 50.0
# 84 184 Nandita Sarchand NSARCHAN ... 4200.0 NaN 121.0 50.0
# 85 185 Alexis Bull ABULL ... 4100.0 NaN 121.0 50.0
# 86 186 Julia Dellinger JDELLING ... 3400.0 NaN 121.0 50.0
# 87 187 Anthony Cabrio ACABRIO ... 3000.0 NaN 121.0 50.0
# 88 188 Kelly Chung KCHUNG ... 3800.0 NaN 122.0 50.0
# 89 189 Jennifer Dilly JDILLY ... 3600.0 NaN 122.0 50.0
# 90 190 Timothy Gates TGATES ... 2900.0 NaN 122.0 50.0
# 91 191 Randall Perkins RPERKINS ... 2500.0 NaN 122.0 50.0
# 92 192 Sarah Bell SBELL ... 4000.0 NaN 123.0 50.0
# 93 193 Britney Everett BEVERETT ... 3900.0 NaN 123.0 50.0
# 94 194 Samuel McCain SMCCAIN ... 3200.0 NaN 123.0 50.0
# 95 195 Vance Jones VJONES ... 2800.0 NaN 123.0 50.0
# 96 196 Alana Walsh AWALSH ... 3100.0 NaN 124.0 50.0
# 97 197 Kevin Feeney KFEENEY ... 3000.0 NaN 124.0 50.0
# 98 198 Donald OConnell DOCONNEL ... 2600.0 NaN 124.0 50.0
# 99 199 Douglas Grant DGRANT ... 2600.0 NaN 124.0 50.0
# [45 rows x 10 columns]
按列取值。
1
2
3
4
5import pandas as pd
df = pd.read_csv("data/employees.csv") # 读取员工数据
print(df.groupby("department_id")["salary"]) # 按department_id分组,取salary列
# <pandas.core.groupby.generic.SeriesGroupBy object at 0x11cde99a0>这里从原来的DataFrame中取某个列名作为一个Series组。与GroupBy对象一样,直到我们运行累计函数,才会开始计算。
1
2
3
4
5
6
7
8
9
10
11
12
13
14
15
16
17import pandas as pd
df = pd.read_csv("data/employees.csv") # 读取员工数据
print(df.groupby("department_id")["salary"].mean()) # 计算每个部门平均薪资
# department_id
# 10.0 4400.000000
# 20.0 9500.000000
# 30.0 4150.000000
# 40.0 6500.000000
# 50.0 3475.555556
# 60.0 5760.000000
# 70.0 10000.000000
# 80.0 8955.882353
# 90.0 19333.333333
# 100.0 8600.000000
# 110.0 10150.000000
# Name: salary, dtype: float64按组迭代。GroupBy对象支持直接按组进行迭代,返回的每一组都是Series或DataFrame。
1
2
3
4
5
6
7
8
9
10
11
12
13
14
15
16import pandas as pd
df = pd.read_csv("data/employees.csv") # 读取员工数据
for dept_id,group in df.groupby("department_id"):
print(f"当前组为{dept_id},组里的数据情况{group.shape}:")
print(group.iloc[:,0:3])
print("-------------------")
# 当前组为10.0,组里的数据情况(1, 10):
# employee_id first_name last_name
# 100 200 Jennifer Whalen
# -------------------
# 当前组为20.0,组里的数据情况(2, 10):
# employee_id first_name last_name
# 101 201 Michael Hartstein
# 102 202 Pat Fay
...按多字段分组。
1
2
3
4
5
6
7
8
9
10
11
12
13
14
15
16
17
18
19
20
21
22
23
24
25
26
27
28
29
30
31
32
33
34
35
36
37
38
39
40
41
42
43
44
45
46
47
48
49
50
51
52
53
54import pandas as pd
df = pd.read_csv("data/employees.csv") # 读取员工数据
salary_mean = df.groupby(["department_id", "job_id"])[
["salary", "commission_pct"]
].mean() # 按department_id和job_id分组
print(salary_mean)
# salary commission_pct
# department_id job_id
# 10.0 AD_ASST 4400.000000 NaN
# 20.0 MK_MAN 13000.000000 NaN
# MK_REP 6000.000000 NaN
# 30.0 PU_CLERK 2780.000000 NaN
# PU_MAN 11000.000000 NaN
# 40.0 HR_REP 6500.000000 NaN
# 50.0 SH_CLERK 3215.000000 NaN
# ST_CLERK 2785.000000 NaN
# ST_MAN 7280.000000 NaN
# 60.0 IT_PROG 5760.000000 NaN
# 70.0 PR_REP 10000.000000 NaN
# 80.0 SA_MAN 12200.000000 0.300000
# SA_REP 8396.551724 0.212069
# 90.0 AD_PRES 24000.000000 NaN
# AD_VP 17000.000000 NaN
# 100.0 FI_ACCOUNT 7920.000000 NaN
# FI_MGR 12000.000000 NaN
# 110.0 AC_ACCOUNT 8300.000000 NaN
# AC_MGR 12000.000000 NaN
print(salary_mean.index) # 查看分组后的索引
# MultiIndex([( 10.0, 'AD_ASST'),
# ( 20.0, 'MK_MAN'),
# ( 20.0, 'MK_REP'),
# ( 30.0, 'PU_CLERK'),
# ( 30.0, 'PU_MAN'),
# ( 40.0, 'HR_REP'),
# ( 50.0, 'SH_CLERK'),
# ( 50.0, 'ST_CLERK'),
# ( 50.0, 'ST_MAN'),
# ( 60.0, 'IT_PROG'),
# ( 70.0, 'PR_REP'),
# ( 80.0, 'SA_MAN'),
# ( 80.0, 'SA_REP'),
# ( 90.0, 'AD_PRES'),
# ( 90.0, 'AD_VP'),
# (100.0, 'FI_ACCOUNT'),
# (100.0, 'FI_MGR'),
# (110.0, 'AC_ACCOUNT'),
# (110.0, 'AC_MGR')],
# names=['department_id', 'job_id'])
print(salary_mean.columns) # 查看分组后的列
# Index(['salary', 'commission_pct'], dtype='object')按多个字段分组后得到的索引为复合索引。可通过reset_index()方法重置索引。
1
2
3
4
5
6
7
8
9
10
11
12
13
14
15
16
17
18
19
20
21print(salary_mean.reset_index())
# department_id job_id salary commission_pct
# 0 10.0 AD_ASST 4400.000000 NaN
# 1 20.0 MK_MAN 13000.000000 NaN
# 2 20.0 MK_REP 6000.000000 NaN
# 3 30.0 PU_CLERK 2780.000000 NaN
# 4 30.0 PU_MAN 11000.000000 NaN
# 5 40.0 HR_REP 6500.000000 NaN
# 6 50.0 SH_CLERK 3215.000000 NaN
# 7 50.0 ST_CLERK 2785.000000 NaN
# 8 50.0 ST_MAN 7280.000000 NaN
# 9 60.0 IT_PROG 5760.000000 NaN
# 10 70.0 PR_REP 10000.000000 NaN
# 11 80.0 SA_MAN 12200.000000 0.300000
# 12 80.0 SA_REP 8396.551724 0.212069
# 13 90.0 AD_PRES 24000.000000 NaN
# 14 90.0 AD_VP 17000.000000 NaN
# 15 100.0 FI_ACCOUNT 7920.000000 NaN
# 16 100.0 FI_MGR 12000.000000 NaN
# 17 110.0 AC_ACCOUNT 8300.000000 NaN
# 18 110.0 AC_MGR 12000.000000 NaN也可以在分组的时候通过as_index = False参数(默认是True)重置索引。
1
2
3
4
5
6
7
8
9
10salary_mean = df.groupby(["department_id", "job_id"], as_index=False)[
["salary", "commission_pct"]
].mean() # 按department_id和job_id分组
print(salary_mean)
# department_id job_id salary commission_pct
# 0 10.0 AD_ASST 4400.000000 NaN
# 1 20.0 MK_MAN 13000.000000 NaN
# 2 20.0 MK_REP 6000.000000 NaN
# 3 30.0 PU_CLERK 2780.000000 NaN
# 4 30.0 PU_MAN 11000.000000 NaNcut()。pandas.cut()用于将连续数据(如数值型数据)分割成离散的区间。可以使用cut()来将数据划分为不同的类别或范围,通常用于数据的分箱处理。cut()部分参数说明:
参数 说明 x 要分箱的数组或Series,通常是数值型数据。 bins 切分区间的数值列表或者整数。如果是整数,则表示将数据均匀地分成多少个区间。如果是列表,则需要指定每个区间的边界。 right 默认True,表示每个区间的右端点是闭区间,即包含右端点。如果设置为False,则左端点为闭区间。 labels 传入一个列表指定每个区间的标签。 1
2
3
4
5
6
7
8
9
10
11
12
13
14
15
16
17
18
19
20
21
22
23
24
25
26
27
28
29
30
31
32
33
34
35
36
37
38
39
40
41
42
43
44
45
46
47
48
49
50
51
52
53
54
55
56
57
58
59
60
61
62
63
64
65import pandas as pd
df = pd.read_csv("data/employees.csv") # 加载员工数据
df1 = df.iloc[9:16][["first_name","salary"]]
df1["cut_res"] = pd.cut(df.iloc[9:16]["salary"], 3)
print(df1)
# first_name salary cut_res
# 9 Daniel 9000.0 (8366.667, 11000.0]
# 10 John 8200.0 (5733.333, 8366.667]
# 11 Ismael 7700.0 (5733.333, 8366.667]
# 12 Jose Manuel 7800.0 (5733.333, 8366.667]
# 13 Luis 6900.0 (5733.333, 8366.667]
# 14 Den 11000.0 (8366.667, 11000.0]
# 15 Alexander 3100.0 (3092.1, 5733.333]
series = df.iloc[9:16]["salary"]
print(type(series))
# <class 'pandas.core.series.Series'>
print(series)
# 9 9000.0
# 10 8200.0
# 11 7700.0
# 12 7800.0
# 13 6900.0
# 14 11000.0
# 15 3100.0
# Name: salary, dtype: float64
salary = pd.cut(series, 3)
print(salary)
# 9 (8366.667, 11000.0]
# 10 (5733.333, 8366.667]
# 11 (5733.333, 8366.667]
# 12 (5733.333, 8366.667]
# 13 (5733.333, 8366.667]
# 14 (8366.667, 11000.0]
# 15 (3092.1, 5733.333]
# Name: salary, dtype: category
# Categories (3, interval[float64, right]): [(3092.1, 5733.333] < (5733.333, 8366.667] <
# (8366.667, 11000.0]]
salary = pd.cut(series, [0, 10000, 20000])
print(salary)
# 9 (0, 10000]
# 10 (0, 10000]
# 11 (0, 10000]
# 12 (0, 10000]
# 13 (0, 10000]
# 14 (10000, 20000]
# 15 (0, 10000]
# Name: salary, dtype: category
# Categories (2, interval[int64, right]): [(0, 10000] < (10000, 20000]]
salary = pd.cut(series, 3, labels=["low", "medium", "high"])
print(salary)
# 9 high
# 10 medium
# 11 medium
# 12 medium
# 13 medium
# 14 high
# 15 low
# Name: salary, dtype: category
# Categories (3, object): ['low' < 'medium' < 'high']
2.9.2 分组聚合
1 | df.groupby("分组字段")["要聚合的字段"].聚合函数() |
常用聚合函数。
方法 说明 sum() 求和 mean() 平均值 min() 最小值 max() 最大值 var() 方差 std() 标准差 median() 中位数 quantile() 指定位置的分位数,如quantile(0.5) describe() 常见统计信息 size() 所有元素的个数 count() 非空元素的个数 first 第一行 last 最后一行 nth 第n行 一次计算多个统计值。可以通过agg()或aggregate()进行更复杂的操作,如一次计算多个统计值。
1
2
3
4
5
6
7
8
9
10df = pd.read_csv("data/employees.csv") # 读取员工数据
# 按department_id分组,计算salary的最小值,中位数,最大值
print(df.groupby("department_id")["salary"].agg(["min", "median", "max"]))
# min median max
# department_id
# 10.0 4400.0 4400.0 4400.0
# 20.0 6000.0 9500.0 13000.0
# 30.0 2500.0 2850.0 11000.0
# 40.0 6500.0 6500.0 6500.0
# 50.0 2100.0 3100.0 8200.0多个列计算不同的统计值。也可以在agg()中传入字典,对多个列计算不同的统计值。
1
2
3
4
5
6
7
8
9
10df = pd.read_csv("data/employees.csv") # 读取员工数据
# 按department_id分组,统计job_id的种类数,commission_pct的平均值
print(df.groupby("department_id").agg({"job_id": "nunique", "commission_pct": "mean"}))
# job_id commission_pct
# department_id
# 10.0 1 NaN
# 20.0 2 NaN
# 30.0 2 NaN
# 40.0 1 NaN
# 50.0 3 NaN重命名统计值。可以在agg()后通过rename()对统计后的列重命名。
1
2
3
4
5
6
7
8
9
10
11
12
13
14
15
16
17
18df = pd.read_csv("data/employees.csv") # 读取员工数据
# 按department_id分组,统计job_id的种类数,commission_pct的平均值
print(
df.groupby("department_id")
.agg(
{"job_id": "nunique", "commission_pct": "mean"},
)
.rename(
columns={"job_id": "工种数", "commission_pct": "佣金比例平均值"},
)
)
# 工种数 佣金比例平均值
# department_id
# 10.0 1 NaN
# 20.0 2 NaN
# 30.0 2 NaN
# 40.0 1 NaN
# 50.0 3 NaN自定义函数。可以向agg()中传入自定义函数进行计算。
1
2
3
4
5
6
7
8
9
10
11
12
13
14
15
16df = pd.read_csv("data/employees.csv") # 读取员工数据
def f(x):
"""统计每个部门员工last_name的首字母"""
result = set()
for i in x:
result.add(i[0])
return result
print(df.groupby("department_id")["last_name"].agg(f))
# department_id
# 10.0 {W}
# 20.0 {F, H}
# 30.0 {B, T, R, C, K, H}
# 40.0 {M}
# 50.0 {O, E, K, S, W, L, P, D, C, V, B, T, M, J, F, ...
2.9.3 分组转换
聚合操作返回的是对组内全量数据缩减过的结果,而转换操作会返回一个新的全量数据。数据经过转换之后,其形状与原来的输入数据是一样的。
通过transform()将每一组的样本数据减去各组的均值,实现数据标准化。
1
2
3
4
5
6
7
8
9
10
11
12
13
14
15
16
17
18
19
20
21
22
23
24
25
26
27
28
29
30
31
32
33import pandas as pd
df = pd.read_csv("data/employees.csv") # 读取员工数据
df["部门平均薪水"] = df.groupby("department_id")["salary"].transform("mean")
print(df)
# employee_id first_name last_name email ... commission_pct manager_id department_id 部门平均薪水
# 0 100 Steven King SKING ... NaN NaN 90.0 19333.333333
# 1 101 N_ann Kochhar NKOCHHAR ... NaN 100.0 90.0 19333.333333
# 2 102 Lex De Haan LDEHAAN ... NaN 100.0 90.0 19333.333333
# 3 103 Alexander Hunold AHUNOLD ... NaN 102.0 60.0 5760.000000
# 4 104 Bruce Ernst BERNST ... NaN 103.0 60.0 5760.000000
# .. ... ... ... ... ... ... ... ... ...
# 102 202 Pat Fay PFAY ... NaN 201.0 20.0 9500.000000
# 103 203 Susan Mavris SMAVRIS ... NaN 101.0 40.0 6500.000000
# 104 204 Hermann Baer HBAER ... NaN 101.0 70.0 10000.000000
# 105 205 Shelley Higgins SHIGGINS ... NaN 101.0 110.0 10150.000000
# 106 206 William Gietz WGIETZ ... NaN 205.0 110.0 10150.000000
# [107 rows x 11 columns]
print(df.groupby("department_id")["salary"].transform(lambda x: x - x.mean()))
# 0 4666.666667
# 1 -2333.333333
# 2 -2333.333333
# 3 3240.000000
# 4 240.000000
# ...
# 102 -3500.000000
# 103 0.000000
# 104 0.000000
# 105 1850.000000
# 106 -1850.000000
# Name: salary, Length: 107, dtype: float64通过transform()按分组使用平均值填充缺失值。
1
2
3
4
5
6
7
8
9
10
11
12
13
14
15
16
17
18
19
20
21
22
23
24
25
26
27
28
29
30
31
32
33
34
35
36
37
38
39
40
41
42
43
44
45
46
47
48import pandas as pd
import numpy as np
df = pd.read_csv("data/employees.csv") # 读取员工数据
index_list = df.index.tolist()
print(type(index_list))
# <class 'list'>
print(index_list)
# [0, 1, 2, 3, 4, 5, 6, 7, 8, 9, 10, 11, 12, 13, 14, 15, 16, 17, 18, 19, 20, 21, 22, 23, 24, 25, 26, 27, 28, 29, 30, 31, 32, 33, 34, 35, 36, 37, 38, 39, 40, 41, 42, 43, 44, 45, 46, 47, 48, 49, 50, 51, 52, 53, 54, 55, 56, 57, 58, 59, 60, 61, 62, 63, 64, 65, 66, 67, 68, 69, 70, 71, 72, 73, 74, 75, 76, 77, 78, 79, 80, 81, 82, 83, 84, 85, 86, 87, 88, 89, 90, 91, 92, 93, 94, 95, 96, 97, 98, 99, 100, 101, 102, 103, 104, 105, 106]
na_index = pd.Series(index_list).sample(30) # 随机挑选30条数据
df.loc[na_index, "salary"] = pd.NA # 将这30条数据的salary设置为缺失值
print(df.groupby("department_id")["salary"].agg(["size", "count"])) # 查看每组数据总数与非空数据数
# size count
# department_id
# 10.0 1 1
# 20.0 2 2
# 30.0 6 5
# 40.0 1 0
# 50.0 45 28
# 60.0 5 3
# 70.0 1 1
# 80.0 34 29
# 90.0 3 1
# 100.0 6 5
# 110.0 2 2
def fill_missing(x):
# 使用平均值填充,如果平均值也为NaN,用0填充
if np.isnan(x.mean()):
return 0
return x.fillna(x.mean())
df["salary"] = df.groupby("department_id")["salary"].transform(fill_missing)
print(df.groupby("department_id")["salary"].agg(["size", "count"])) # 查看每组数据总数与非空数据数
# size count
# department_id
# 10.0 1 1
# 20.0 2 2
# 30.0 6 6
# 40.0 1 1
# 50.0 45 45
# 60.0 5 5
# 70.0 1 1
# 80.0 34 34
# 90.0 3 3
# 100.0 6 6
# 110.0 2 2
2.9.4 分组过滤
过滤操作可以让我们按照分组的属性丢弃若干数据。
例如,我们可能只需要保留commission_pct不包含空值的分组的数据。
1
2
3
4
5
6
7
8
9
10
11
12
13
14
15
16
17
18
19
20
21
22
23
24
25
26
27
28
29
30
31
32
33
34
35
36
37
38
39
40
41
42
43
44
45import pandas as pd
import numpy as np
df = pd.read_csv("data/employees.csv") # 读取员工数据
commission_pct_filter = df.groupby("department_id").filter(
lambda x: x["commission_pct"].notnull().all()
) # 按department_id分组,过滤掉commission_pct包含空值的分组
print(commission_pct_filter)
# employee_id first_name last_name email ... salary commission_pct manager_id department_id
# 45 145 John Russell JRUSSEL ... 14000.0 0.40 100.0 80.0
# 46 146 Karen Partners KPARTNER ... 13500.0 0.30 100.0 80.0
# 47 147 Alberto Errazuriz AERRAZUR ... 12000.0 0.30 100.0 80.0
# 48 148 Gerald Cambrault GCAMBRAU ... 11000.0 0.30 100.0 80.0
# 49 149 Eleni Zlotkey EZLOTKEY ... 10500.0 0.20 100.0 80.0
# 50 150 Peter Tucker PTUCKER ... 10000.0 0.30 145.0 80.0
# 51 151 David Bernstein DBERNSTE ... 9500.0 0.25 145.0 80.0
# 52 152 Peter Hall PHALL ... 9000.0 0.25 145.0 80.0
# 53 153 Christopher Olsen COLSEN ... 8000.0 0.20 145.0 80.0
# 54 154 Nanette Cambrault NCAMBRAU ... 7500.0 0.20 145.0 80.0
# 55 155 Oliver Tuvault OTUVAULT ... 7000.0 0.15 145.0 80.0
# 56 156 Janette King JKING ... 10000.0 0.35 146.0 80.0
# 57 157 Patrick Sully PSULLY ... 9500.0 0.35 146.0 80.0
# 58 158 Allan McEwen AMCEWEN ... 9000.0 0.35 146.0 80.0
# 59 159 Lindsey Smith LSMITH ... 8000.0 0.30 146.0 80.0
# 60 160 Louise Doran LDORAN ... 7500.0 0.30 146.0 80.0
# 61 161 Sarath Sewall SSEWALL ... 7000.0 0.25 146.0 80.0
# 62 162 Clara Vishney CVISHNEY ... 10500.0 0.25 147.0 80.0
# 63 163 Danielle Greene DGREENE ... 9500.0 0.15 147.0 80.0
# 64 164 Mattea Marvins MMARVINS ... 7200.0 0.10 147.0 80.0
# 65 165 David Lee DLEE ... 6800.0 0.10 147.0 80.0
# 66 166 Sundar Ande SANDE ... 6400.0 0.10 147.0 80.0
# 67 167 Amit Banda ABANDA ... 6200.0 0.10 147.0 80.0
# 68 168 Lisa Ozer LOZER ... 11500.0 0.25 148.0 80.0
# 69 169 Harrison Bloom HBLOOM ... 10000.0 0.20 148.0 80.0
# 70 170 Tayler Fox TFOX ... 9600.0 0.20 148.0 80.0
# 71 171 William Smith WSMITH ... 7400.0 0.15 148.0 80.0
# 72 172 Elizabeth Bates EBATES ... 7300.0 0.15 148.0 80.0
# 73 173 Sundita Kumar SKUMAR ... 6100.0 0.10 148.0 80.0
# 74 174 Ellen Abel EABEL ... 11000.0 0.30 149.0 80.0
# 75 175 Alyssa Hutton AHUTTON ... 8800.0 0.25 149.0 80.0
# 76 176 Jonathon Taylor JTAYLOR ... 8600.0 0.20 149.0 80.0
# 77 177 Jack Livingston JLIVINGS ... 8400.0 0.20 149.0 80.0
# 79 179 Charles Johnson CJOHNSON ... 6200.0 0.10 149.0 80.0
# [34 rows x 10 columns]
2.10 Pandas透视表
2.10.1 什么是透视表
- 透视表(pivot table)是各种电子表格程序和其他数据分析软件中一种常见的数据汇总工具。它可以根据多个行分组键和多个列分组键对数据进行聚合,并根据行和列上的分组键将数据分配到各个矩形区域中。
2.10.2 pivot_table
pandas中提供了DataFrame.pivot_table()和pandas.pivot_table()方法来生成透视表。两者的区别是pandas.pivot_table()需要额外传入一个data参数指定对哪个DataFrame进行处理。
pivot_table()的参数如下:
参数 说明 values 待聚合的列,默认聚合所有数值列。 index 用作透视表行索引的列。即通过哪个(些)行来对数据进行分组,行索引决定了透视表的行维度。 columns 用作透视表列索引的列。即通过哪个(些)列来对数据进行分组,列索引决定了透视表的列维度。 aggfunc 聚合函数或函数列表,默认为mean。 fill_value 用于替换结果表中的缺失值。 margins 是否在透视表的边缘添加汇总行和列,显示总计。默认值是 False,如果设置为 True,会添加“总计”行和列,方便查看数据的总体汇总。 dropna 是否排除包含缺失值的行和列。默认为 True,即如果某个组合的行列数据中包含缺失值,则会被排除在外。如果设置为 False,则会保留这些含有缺失值的行和列。 observerd 是否显示所有组合数据,True:只显示实际存在的组合。
2.10.3 案例:睡眠质量分析透视表
使用sleep(睡眠健康和生活方式)数据集,其中包含13个字段:
- person_id:每个人的唯一标识符。
- gender:个人的性别(男/女)。
- age:个人的年龄(以岁为单位)。
- occupation:个人的职业或就业状况(例如办公室职员、体力劳动者、学生)。
- sleep_duration:每天的睡眠总小时数。
- sleep_quality:睡眠质量的主观评分,范围从 1(差)到 10(极好)。
- physical_activity_level:每天花费在体力活动上的时间(以分钟为单位)。
- stress_level:压力水平的主观评级,范围从 1(低)到 10(高)。
- bmi_category:个人的 BMI 分类(体重过轻、正常、超重、肥胖)。
- blood_pressure:血压测量,显示为收缩压与舒张压的数值。
- heart_rate:静息心率,以每分钟心跳次数为单位。
- daily_steps:个人每天行走的步数。
- sleep_disorder:存在睡眠障碍(无、失眠、睡眠呼吸暂停)。
统计不同睡眠时间,不同压力等级下的睡眠质量。
1
2
3
4
5
6
7
8
9
10
11
12
13
14
15
16
17
18
19
20
21
22
23
24
25
26
27
28
29
30
31
32
33
34
35
36
37
38
39
40import pandas as pd
df = pd.read_csv("data/sleep.csv")
sleep_duration_stage = pd.cut(df["sleep_duration"], [0, 5, 6, 7, 8, 9, 10, 11, 12]) # 对睡眠时间进行划分
stress_level_stage = pd.cut(df["stress_level"], 4) # 对压力等级进行划分
print(df.pivot_table(values="sleep_quality", index=[sleep_duration_stage, stress_level_stage], aggfunc="mean"))
# sleep_quality
# sleep_duration stress_level
# (0, 5] (0.991, 3.25] 6.781818
# (3.25, 5.5] 6.161538
# (5.5, 7.75] 5.677778
# (7.75, 10.0] 6.082353
# (5, 6] (0.991, 3.25] 5.876923
# (3.25, 5.5] 6.777778
# (5.5, 7.75] 6.058333
# (7.75, 10.0] 6.438462
# (6, 7] (0.991, 3.25] 6.472727
# (3.25, 5.5] 5.841667
# (5.5, 7.75] 5.377778
# (7.75, 10.0] 5.545455
# (7, 8] (0.991, 3.25] 6.314286
# (3.25, 5.5] 5.375000
# (5.5, 7.75] 7.280000
# (7.75, 10.0] 5.700000
# (8, 9] (0.991, 3.25] 5.423077
# (3.25, 5.5] 6.640000
# (5.5, 7.75] 5.877778
# (7.75, 10.0] 6.320000
# (9, 10] (0.991, 3.25] 5.788235
# (3.25, 5.5] 6.790000
# (5.5, 7.75] 6.010000
# (7.75, 10.0] 6.287500
# (10, 11] (0.991, 3.25] 5.853333
# (3.25, 5.5] 6.057143
# (5.5, 7.75] 6.000000
# (7.75, 10.0] 6.083333
# (11, 12] (0.991, 3.25] 6.335294
# (3.25, 5.5] 6.700000
# (5.5, 7.75] 6.071429
# (7.75, 10.0] 6.370588添加职业作为列维度。
1
2
3
4
5
6
7
8
9
10
11
12
13
14
15
16
17
18
19
20
21
22
23
24
25
26
27
28
29
30
31
32
33
34
35
36
37
38
39
40
41
42
43
44import pandas as pd
df = pd.read_csv("data/sleep.csv")
sleep_duration_stage = pd.cut(df["sleep_duration"], [0, 5, 6, 7, 8, 9, 10, 11, 12]) # 对睡眠时间进行划分
stress_level_stage = pd.cut(df["stress_level"], 4) # 对压力等级进行划分
print(
df.pivot_table(
values="sleep_quality", index=[sleep_duration_stage, stress_level_stage], columns=["occupation"], aggfunc="mean"
)
)
# occupation Manual Labor Office Worker Retired Student
# sleep_duration stress_level
# (0, 5] (0.991, 3.25] 6.900000 6.350000 6.720000 6.750000
# (3.25, 5.5] 3.300000 7.966667 6.060000 5.650000
# (5.5, 7.75] 4.833333 6.900000 3.200000 6.533333
# (7.75, 10.0] 7.200000 5.977778 5.225000 7.150000
# (5, 6] (0.991, 3.25] 5.220000 6.433333 5.700000 6.533333
# (3.25, 5.5] 5.000000 7.050000 6.900000 9.000000
# (5.5, 7.75] 6.050000 5.300000 5.300000 7.200000
# (7.75, 10.0] 6.475000 4.050000 NaN 7.100000
# (6, 7] (0.991, 3.25] 7.900000 NaN 5.866667 7.025000
# (3.25, 5.5] 4.900000 4.250000 7.600000 5.650000
# (5.5, 7.75] NaN 5.466667 7.150000 4.425000
# (7.75, 10.0] 5.600000 6.000000 6.600000 4.720000
# (7, 8] (0.991, 3.25] 5.600000 7.700000 6.571429 5.100000
# (3.25, 5.5] 3.400000 5.033333 6.400000 6.033333
# (5.5, 7.75] 5.500000 6.600000 NaN 9.400000
# (7.75, 10.0] 5.100000 5.750000 6.071429 5.475000
# (8, 9] (0.991, 3.25] 5.100000 NaN 4.800000 5.742857
# (3.25, 5.5] 6.000000 8.100000 4.000000 NaN
# (5.5, 7.75] 4.600000 NaN 6.225000 5.850000
# (7.75, 10.0] 6.100000 5.466667 6.566667 7.240000
# (9, 10] (0.991, 3.25] 8.125000 5.200000 4.250000 5.550000
# (3.25, 5.5] 6.600000 7.500000 7.300000 5.933333
# (5.5, 7.75] 6.150000 5.466667 4.733333 8.600000
# (7.75, 10.0] 5.760000 5.540000 8.000000 6.050000
# (10, 11] (0.991, 3.25] 5.633333 5.725000 4.700000 7.300000
# (3.25, 5.5] 6.466667 5.780000 5.880000 7.100000
# (5.5, 7.75] 3.700000 6.825000 6.600000 5.900000
# (7.75, 10.0] 6.585714 6.180000 6.900000 4.675000
# (11, 12] (0.991, 3.25] 4.850000 6.171429 5.850000 7.183333
# (3.25, 5.5] 7.500000 5.600000 NaN 8.100000
# (5.5, 7.75] 5.825000 4.100000 7.550000 NaN
# (7.75, 10.0] 6.357143 6.740000 4.866667 7.750000添加性别作为第二个列维度。
1
2
3
4
5
6
7
8
9
10
11
12
13
14
15
16
17
18
19
20
21
22
23
24
25
26
27
28
29
30
31
32
33
34
35
36
37
38
39
40
41
42
43
44
45
46
47
48import pandas as pd
df = pd.read_csv("data/sleep.csv")
sleep_duration_stage = pd.cut(df["sleep_duration"], [0, 5, 6, 7, 8, 9, 10, 11, 12]) # 对睡眠时间进行划分
stress_level_stage = pd.cut(df["stress_level"], 4) # 对压力等级进行划分
print(
df.pivot_table(
values="sleep_quality",
index=[sleep_duration_stage, stress_level_stage],
columns=["occupation", "gender"],
aggfunc="mean",
)
)
# occupation Manual Labor Office Worker Retired Student
# gender Female Male Female Male Female Male Female Male
# sleep_duration stress_level
# (0, 5] (0.991, 3.25] 6.75 7.300000 6.700000 6.000 NaN 6.720000 6.100000 7.400000
# (3.25, 5.5] 3.30 NaN 7.100000 9.700 4.850000 6.866667 5.300000 6.700000
# (5.5, 7.75] 4.55 5.400000 5.900000 7.900 NaN 3.200000 6.850000 5.900000
# (7.75, 10.0] 8.40 6.000000 5.180000 6.975 6.600000 4.766667 7.150000 NaN
# (5, 6] (0.991, 3.25] 5.50 4.800000 8.200000 5.550 5.700000 NaN 8.150000 3.300000
# (3.25, 5.5] 5.00 NaN 6.600000 7.500 6.700000 7.100000 9.000000 NaN
# (5.5, 7.75] 6.60 5.500000 4.900000 6.100 4.450000 7.000000 7.066667 7.600000
# (7.75, 10.0] 6.15 6.800000 NaN 4.050 NaN NaN 7.266667 6.975000
# (6, 7] (0.991, 3.25] 7.90 NaN NaN NaN 6.700000 4.200000 6.566667 8.400000
# (3.25, 5.5] NaN 4.900000 NaN 4.250 NaN 7.600000 6.900000 5.400000
# (5.5, 7.75] NaN NaN 6.000000 4.400 7.150000 NaN 5.150000 3.700000
# (7.75, 10.0] 5.60 NaN 6.600000 5.400 4.900000 10.000000 4.720000 NaN
# (7, 8] (0.991, 3.25] 4.40 8.000000 NaN 7.700 8.500000 5.800000 5.700000 4.500000
# (3.25, 5.5] NaN 3.400000 5.800000 4.650 6.400000 NaN NaN 6.033333
# (5.5, 7.75] NaN 5.500000 NaN 6.600 NaN NaN NaN 9.400000
# (7.75, 10.0] 3.80 5.750000 NaN 5.750 NaN 6.071429 4.300000 9.000000
# (8, 9] (0.991, 3.25] 5.10 NaN NaN NaN NaN 4.800000 6.333333 5.300000
# (3.25, 5.5] 6.60 5.850000 8.650000 7.550 4.000000 NaN NaN NaN
# (5.5, 7.75] NaN 4.600000 NaN NaN 5.150000 7.300000 5.450000 6.250000
# (7.75, 10.0] NaN 6.100000 4.433333 6.500 7.000000 6.350000 2.000000 8.550000
# (9, 10] (0.991, 3.25] 8.00 8.250000 4.000000 5.800 3.700000 4.800000 6.400000 5.380000
# (3.25, 5.5] 6.60 NaN 7.500000 NaN 7.100000 7.400000 NaN 5.933333
# (5.5, 7.75] 6.15 NaN 5.750000 4.900 2.800000 5.700000 8.600000 NaN
# (7.75, 10.0] 5.76 NaN 5.900000 5.450 7.333333 10.000000 NaN 6.050000
# (10, 11] (0.991, 3.25] 5.85 5.200000 3.750000 7.700 4.700000 4.700000 6.933333 8.400000
# (3.25, 5.5] 6.85 5.700000 5.275000 7.800 4.200000 7.000000 NaN 7.100000
# (5.5, 7.75] 2.80 4.600000 6.825000 NaN 8.100000 5.850000 7.800000 4.633333
# (7.75, 10.0] 5.55 7.966667 6.633333 5.500 9.100000 4.700000 4.300000 5.050000
# (11, 12] (0.991, 3.25] 4.85 NaN 4.100000 7.725 NaN 5.850000 6.566667 7.800000
# (3.25, 5.5] NaN 7.500000 5.600000 NaN NaN NaN NaN 8.100000
# (5.5, 7.75] 3.95 7.700000 NaN 4.100 7.550000 NaN NaN NaN
# (7.75, 10.0] 6.00 6.625000 6.066667 7.750 5.200000 4.200000 9.200000 6.300000
2.11 Pandas时间序列
2.11.1 Python中的日期与时间工具
Python基本的日期与时间功能都在标准库的datetime模块中。
1
2
3
4
5
6
7
8
9
10
11
12from datetime import datetime
date1 = datetime(year=2000, month=1, day=1)
date2 = datetime.now()
print(date1) # 2000-01-01 00:00:00
print(date2) # 2025-01-01 00:00:00
print(date1.year) # 2000
print(date1.month) # 1
print(date1.day) # 1
print(date2.weekday()) # 5
print(date2.strftime("%A")) # Saturday
print(date2 - date1) # 18263 days, 0:00:00
2.11.2 pandas中的日期与时间
pandas的日期时间类型默认是datetime64[ns]。
- 针对时间戳数据,pandas提供了Timestamp类型。它本质上是Python原生datetime类型的替代品,但是在性能更好的numpy.datetime64类型的基础上创建。对应的索引数据结构是DatetimeIndex。
- 针对时间周期数据,pandas提供了Period类型。这是利用numpy.datetime64类型将固定频率的时间间隔进行编码。对应的索引数据结构是PeriodIndex。
- 针对时间增量或持续时间,pandas提供了Timedelta类型。Timedelta是一种代替Python原生datetime.timedelta类型的高性能数据结构,同样是基于numpy.timedelta64类型。对应的索引数据结构是TimedeltaIndex。
datetime64
to_datetime()可以解析许多日期与时间格式。对to_datetime()传递一个日期会返回一个Timestamp类型,传递一个时间序列会返回一个DatetimeIndex类型。
1
2
3
4print(pd.to_datetime("2015-01-01"))
# 2015-01-01 00:00:00
print(pd.to_datetime(["4th of July, 2015", "2015-Jul-6", "07-07-2015", "20150708"], format="mixed"))
# DatetimeIndex(['2015-07-04', '2015-07-06', '2015-07-07', '2015-07-08'], dtype='datetime64[ns]', freq=None)在加载数据时,可以通过to_datetime()将数据中的列解析为datetime64。
1
2
3
4
5
6
7
8
9
10
11
12
13
14
15df = pd.read_csv("data/weather.csv")
print(df["date"].tail())
# 1456 2015-12-27
# 1457 2015-12-28
# 1458 2015-12-29
# 1459 2015-12-30
# 1460 2015-12-31
# Name: date, dtype: object
print(pd.to_datetime(df["date"]).tail())
# 1456 2015-12-27
# 1457 2015-12-28
# 1458 2015-12-29
# 1459 2015-12-30
# 1460 2015-12-31
# Name: date, dtype: datetime64[ns]在加载数据时也可以通过parse_dates参数将指定列解析为datetime64。
1
2
3
4
5
6
7
8df = pd.read_csv("data/weather.csv", parse_dates=[0])
print(df["date"].tail())
# 1456 2015-12-27
# 1457 2015-12-28
# 1458 2015-12-29
# 1459 2015-12-30
# 1460 2015-12-31
# Name: date, dtype: datetime64[ns]
提取日期的各个部分
提取Timestamp。
1
2
3
4
5
6
7
8d = pd.Timestamp("2015-01-01 09:08:07.123456")
print(d.year) # 2015
print(d.month) # 1
print(d.day) # 1
print(d.hour) # 9
print(d.minute) # 8
print(d.second) # 7
print(d.microsecond) # 123456对于Series对象,需要使用dt访问器。
1
2
3
4
5
6
7
8
9
10
11
12df = pd.read_csv("data/weather.csv", parse_dates=[0])
df_date = pd.to_datetime(df["date"])
df["year"] = df_date.dt.year
df["month"] = df_date.dt.month
df["day"] = df_date.dt.day
print(df[["date", "year", "month", "day"]].tail())
# date year month day
# 1456 2015-12-27 2015 12 27
# 1457 2015-12-28 2015 12 28
# 1458 2015-12-29 2015 12 29
# 1459 2015-12-30 2015 12 30
# 1460 2015-12-31 2015 12 31
period。可以通过to_period()方法和一个频率代码将datetime64类型转换成period类型。
1
2
3
4
5
6
7
8
9df = pd.read_csv("data/weather.csv")
df["quarter"] = pd.to_datetime(df["date"]).dt.to_period("Q") # 将 年-月-日 转换为 年季度
print(df[["date", "quarter"]].head())
# date quarter
# 0 2012-01-01 2012Q1
# 1 2012-01-02 2012Q1
# 2 2012-01-03 2012Q1
# 3 2012-01-04 2012Q1
# 4 2012-01-05 2012Q1timedelta64。当用一个日期减去另一个日期,返回的结果是timedelta64类型。
1
2
3
4
5
6
7
8
9
10df = pd.read_csv("data/weather.csv", parse_dates=[0])
df_date = pd.to_datetime(df["date"])
timedelta = df_date - df_date[0]
print(timedelta.head())
# 0 0 days
# 1 1 days
# 2 2 days
# 3 3 days
# 4 4 days
# Name: date, dtype: timedelta64[ns]
2.11.3 使用时间作为索引
DatetimeIndex
将datetime64类型的数据设置为索引,得到的就是DatetimeIndex。
1
2
3
4
5
6
7
8
9
10
11
12
13
14
15
16
17
18import pandas as pd
df = pd.read_csv("data/weather.csv")
df["date"] = pd.to_datetime(df["date"]) # 将date列转换为datetime64类型
df.set_index("date", inplace=True) # 将date列设置为索引
df.info()
# <class 'pandas.core.frame.DataFrame'>
# DatetimeIndex: 1461 entries, 2012-01-01 to 2015-12-31
# Data columns (total 5 columns):
# # Column Non-Null Count Dtype
# --- ------ -------------- -----
# 0 precipitation 1461 non-null float64
# 1 temp_max 1461 non-null float64
# 2 temp_min 1461 non-null float64
# 3 wind 1461 non-null float64
# 4 weather 1461 non-null object
# dtypes: float64(4), object(1)
# memory usage: 68.5+ KB将时间作为索引后可以直接使用时间进行切片取值。
1
2
3
4
5
6
7
8
9
10
11
12
13
14
15
16print(df.loc["2013-01":"2013-06"]) # 获取2013年1~6月的数据
# precipitation temp_max temp_min wind weather
# date
# 2013-01-01 0.0 5.0 -2.8 2.7 sun
# 2013-01-02 0.0 6.1 -1.1 3.2 sun
# 2013-01-03 4.1 6.7 -1.7 3.0 rain
# 2013-01-04 2.5 10.0 2.2 2.8 rain
# 2013-01-05 3.0 6.7 4.4 3.1 rain
# ... ... ... ... ... ...
# 2013-06-26 2.0 22.2 15.0 2.3 rain
# 2013-06-27 3.6 21.1 16.7 1.3 rain
# 2013-06-28 0.0 30.6 16.1 2.2 sun
# 2013-06-29 0.0 30.0 18.3 1.7 sun
# 2013-06-30 0.0 33.9 17.2 2.5 sun
# [181 rows x 5 columns]也可以通过between_time()和at_time()获取某些时刻的数据。
1
2df.between_time("9:00", "11:00") # 获取9:00到11:00之间的数据
df.at_time("3:33") # 获取3:33的数据
TimedeltaIndex
将timedelta64类型的数据设置为索引,得到的就是TimedeltaIndex。
1
2
3
4
5
6
7
8
9
10
11
12
13
14
15
16
17
18
19
20import pandas as pd
df = pd.read_csv("data/weather.csv", parse_dates=[0])
df_date = pd.to_datetime(df["date"])
df["timedelta"] = df_date - df_date[0] # 得到timedelta64类型的数据
df.set_index("timedelta", inplace=True) # 将timedelta列设置为索引
df.info()
# <class 'pandas.core.frame.DataFrame'>
# TimedeltaIndex: 1461 entries, 0 days to 1460 days
# Data columns (total 6 columns):
# # Column Non-Null Count Dtype
# --- ------ -------------- -----
# 0 date 1461 non-null datetime64[ns]
# 1 precipitation 1461 non-null float64
# 2 temp_max 1461 non-null float64
# 3 temp_min 1461 non-null float64
# 4 wind 1461 non-null float64
# 5 weather 1461 non-null object
# dtypes: datetime64[ns](1), float64(4), object(1)
# memory usage: 79.9+ KB将时间作为索引后可以直接使用时间进行切片取值。
1
2
3
4
5
6
7
8
9print(df.loc["0 days":"5 days"])
# date precipitation temp_max temp_min wind weather
# timedelta
# 0 days 2012-01-01 0.0 12.8 5.0 4.7 drizzle
# 1 days 2012-01-02 10.9 10.6 2.8 4.5 rain
# 2 days 2012-01-03 0.8 11.7 7.2 2.3 rain
# 3 days 2012-01-04 20.3 12.2 5.6 4.7 rain
# 4 days 2012-01-05 1.3 8.9 2.8 6.1 rain
# 5 days 2012-01-06 2.5 4.4 2.2 2.2 rain
2.11.4 生成时间序列
为了能更简便地创建有规律的时间序列,pandas提供了date_range()方法。
date_range()
date_range()通过开始日期、结束日期和频率代码(可选)创建一个有规律的日期序列,默认的频率是天。
1
2
3
4print(pd.date_range("2015-07-03", "2015-07-10"))
# DatetimeIndex(['2015-07-03', '2015-07-04', '2015-07-05', '2015-07-06',
# '2015-07-07', '2015-07-08', '2015-07-09', '2015-07-10'],
# dtype='datetime64[ns]', freq='D')此外,日期范围不一定非是开始时间与结束时间,也可以是开始时间与周期数periods。
1
2
3
4print(pd.date_range("2015-07-03", periods=5))
# DatetimeIndex(['2015-07-03', '2015-07-04', '2015-07-05', '2015-07-06',
# '2015-07-07'],
# dtype='datetime64[ns]', freq='D')可以通过freq参数设置时间频率,默认值是D。此处改为h,按小时变化的时间戳。
1
2
3
4
5print(pd.date_range("2015-07-03", periods=5, freq="h"))
# DatetimeIndex(['2015-07-03 00:00:00', '2015-07-03 01:00:00',
# '2015-07-03 02:00:00', '2015-07-03 03:00:00',
# '2015-07-03 04:00:00'],
# dtype='datetime64[ns]', freq='h')
时间频率与偏移量
可通过freq参数设置时间频率。下表为常见时间频率代码与说明:
代码 说明 D 天(calendar day,按日历算,含双休日) B 天(business day,仅含工作日) W 周(weekly) ME / M 月末(month end) BME 月末(business month end,仅含工作日) MS 月初(month start) BMS 月初(business month start,仅含工作日) QE / Q 季末(quarter end) BQE 季末(business quarter end,仅含工作日) QS 季初(quarter start) BQS 季初(business quarter start,仅含工作日) YE / Y 年末(year end) BYE 年末(business year end,仅含工作日) YS 年初(year start) BYS 年初(business year start,仅含工作日) h 小时(hours) bh 小时(business hours,工作时间) min 分钟(minutes) s 秒(seconds) ms 毫秒(milliseonds) us 微秒(microseconds) ns 纳秒(nanoseconds) 偏移量。
可以在频率代码后面加三位月份缩写字母来改变季、年频率的开始时间。
- QE-JAN、BQE-FEB、QS-MAR、BQS-APR等。
- YE-JAN、BYE-FEB、YS-MAR、BYS-APR等。
1
2
3
4
5print(pd.date_range("2015-07-03", periods=10, freq="QE-JAN")) # 设置1月为季度末
# DatetimeIndex(['2015-07-31', '2015-10-31', '2016-01-31', '2016-04-30',
# '2016-07-31', '2016-10-31', '2017-01-31', '2017-04-30',
# '2017-07-31', '2017-10-31'],
# dtype='datetime64[ns]', freq='QE-JAN')同理,也可以在后面加三位星期缩写字母来改变一周的开始时间。
- W-SUN、W-MON、W-TUE、W-WED等。
1
2
3
4
5print(pd.date_range("2015-07-03", periods=10, freq="W-WED")) # 设置周三为一周的第一天
# DatetimeIndex(['2015-07-08', '2015-07-15', '2015-07-22', '2015-07-29',
# '2015-08-05', '2015-08-12', '2015-08-19', '2015-08-26',
# '2015-09-02', '2015-09-09'],
# dtype='datetime64[ns]', freq='W-WED')在这些代码的基础上,还可以将频率组合起来创建的新的周期。例如,可以用小时(h)和分钟(min)的组合来实现2小时30分钟。
1
2
3
4
5
6
7print(pd.date_range("2015-07-03", periods=10, freq="2h30min"))
# DatetimeIndex(['2015-07-03 00:00:00', '2015-07-03 02:30:00',
# '2015-07-03 05:00:00', '2015-07-03 07:30:00',
# '2015-07-03 10:00:00', '2015-07-03 12:30:00',
# '2015-07-03 15:00:00', '2015-07-03 17:30:00',
# '2015-07-03 20:00:00', '2015-07-03 22:30:00'],
# dtype='datetime64[ns]', freq='150min')
2.11.5 重新采样
处理时间序列数据时,经常需要按照新的频率(更高频率、更低频率)对数据进行重新采样。可以通过resample()方法解决这个问题。resample()方法以数据累计为基础,会将数据按指定的时间周期进行分组,之后可以对其使用聚合函数。
1
2
3
4
5
6
7
8
9
10
11
12import pandas as pd
df = pd.read_csv("data/weather.csv")
df["date"] = pd.to_datetime(df["date"])
df.set_index("date", inplace=True)
print(df[["temp_max", "temp_min"]].resample("YE").mean()) # 将数据按年分组,并计算每年的平均最高最低温度
# temp_max temp_min
# date
# 2012-12-31 15.276776 7.289617
# 2013-12-31 16.058904 8.153973
# 2014-12-31 16.995890 8.662466
# 2015-12-31 17.427945 8.835616
2.12 Matplotlib可视化
2.12.1 Matplotlib简介
- Matplotlib是一个Python绘图库,广泛用于创建各种类型的静态、动态和交互式图表。它是数据科学、机器学习、工程和科学计算领域中常用的绘图工具之一。
- 支持多种图表类型:折线图(Line plots)、散点图(Scatter plots)、柱状图(Bar charts)、直方图(Histograms)、饼图(Pie charts)、热图(Heatmaps)、箱型图(Box plots)、极坐标图(Polar plots)、3D图(3D plots,配合 mpl_toolkits.mplot3d)。
- 高度自定义:允许用户自定义图表的每个部分,包括标题、轴标签、刻度、图例等。 支持多种颜色、字体和线条样式。提供精确的图形渲染控制,如坐标轴范围、图形大小、字体大小等。
- 兼容性:与NumPy、Pandas等库紧密集成,特别适用于绘制基于数据框和数组的数据可视化。可以输出到多种格式(如PNG、PDF、SVG、EPS等)。
- 交互式绘图:在Jupyter Notebook 中,Matplotlib支持交互式绘图,可以动态更新图表。支持图形缩放、平移等交互操作。
- 动态图表:可以生成动画(使用FuncAnimation类),为用户提供动态数据的可视化。
- 不同开发环境下显示图形。
- 在一个脚本文件中使用Matplotlib,那么显示图形的时候必须使用plt.show()。
- 在Notebook中使用Matplotlib,运行命令之后在每一个Notebook的单元中就会直接将PNG格式图形文件嵌入在单元中。
2.12.2 两种画图接口
Matplotlib有两种画图接口:一个是便捷的MATLAB风格的有状态的接口,另一个是功能更强大的面向对象接口。
状态接口
1
2
3
4
5
6
7
8
9
10
11
12
13
14
15
16
17
18
19
20
21
22
23
24
25
26import numpy as np
import matplotlib.pyplot as plt # 导入matplotlib
x = np.linspace(0, 10, 100) # 创建x轴的数据
y1 = np.sin(x) # 创建y轴的数据
y2 = np.cos(x) # 创建y轴的数据
plt.figure(figsize=(10, 6)) # 创建画布,并指定画布大小 10*6英寸
plt.subplot(2, 1, 1) # 创建2行1列个子图,并指定第1个子图
plt.xlim(0, 10) # 设置x轴的范围
plt.ylim(-1, 1) # 设置y轴的范围
plt.xlabel("x") # 设置x轴的标签
plt.ylabel("sin(x)") # 设置y轴的标签
plt.title("sin") # 设置子图的标题
plt.plot(x, y1) # 绘制曲线
plt.subplot(2, 1, 2) # 创建2行1列个子图,并指定第2个子图
plt.xlim(0, 10) # 设置x轴的范围
plt.ylim(-1, 1) # 设置y轴的范围
plt.xlabel("x") # 设置x轴的标签
plt.ylabel("cos(x)") # 设置y轴的标签
plt.title("cos") # 设置子图的标题
plt.plot(x, y2)
plt.show() # 显示图像![image-20250629110650344]()
面向对象接口
1
2
3
4
5
6
7
8
9
10
11
12
13
14
15
16
17
18
19
20
21
22
23
24import numpy as np
import matplotlib.pyplot as plt # 导入matplotlib
x = np.linspace(0, 10, 100) # 创建x轴的数据
y1 = np.sin(x) # 创建y轴的数据
y2 = np.cos(x) # 创建y轴的数据
fig, ax = plt.subplots(2, figsize=(10, 6)) # 创建画布,并指定画布大小
ax[0].set_xlim(0, 10) # 设置x轴的范围
ax[0].set_ylim(-1, 1) # 设置y轴的范围
ax[0].set_xlabel("x") # 设置x轴的标签
ax[0].set_ylabel("sin(x)") # 设置y轴的标签
ax[0].set_title("sin") # 设置子图的标题
ax[0].plot(x, y1) # 绘制曲线
ax[1].plot(x, y2) # 绘制曲线
ax[1].set_xlim(0, 10) # 设置x轴的范围
ax[1].set_ylim(-1, 1) # 设置y轴的范围
ax[1].set_xlabel("x") # 设置x轴的标签
ax[1].set_ylabel("cos(x)") # 设置y轴的标签
ax[1].set_title("cos") # 设置子图的标题
plt.show()![image-20250629110742364]()
2.12.3 单变量可视化
使用weather(天气)数据集。其中包含6个字段:
- date:日期,年-月-日格式。
- precipitation:降水量。
- temp_max:最高温度。
- temp_min:最低温度。
- wind:风力。
- weather:天气状况。
加载数据:
1
2
3
4
5
6
7
8
9
10
11
12
13
14
15
16
17
18
19
20
21
22import pandas as pd
import matplotlib.pyplot as plt
from matplotlib import rcParams
rcParams["font.sans-serif"] = ["SimHei"] # 指定中文字体
rcParams["axes.unicode_minus"] = False # 解决负号显示问题
df = pd.read_csv("data/weather.csv")
df.info() # 查看数据集信息
# <class 'pandas.core.frame.DataFrame'>
# RangeIndex: 1461 entries, 0 to 1460
# Data columns (total 6 columns):
# # Column Non-Null Count Dtype
# --- ------ -------------- -----
# 0 date 1461 non-null object
# 1 precipitation 1461 non-null float64
# 2 temp_max 1461 non-null float64
# 3 temp_min 1461 non-null float64
# 4 wind 1461 non-null float64
# 5 weather 1461 non-null object
# dtypes: float64(4), object(2)
# memory usage: 68.6+ KB使用直方图将降水量分组并绘制每组出现频次。
1
2
3
4
5
6
7
8
9
10
11
12
13
14import pandas as pd
import matplotlib.pyplot as plt
from matplotlib import rcParams
rcParams["font.sans-serif"] = ["SimHei"] # 指定中文字体
rcParams["axes.unicode_minus"] = False # 解决负号显示问题
df = pd.read_csv("data/weather.csv")
fig = plt.figure()
ax1 = fig.add_subplot(1, 1, 1)
ax1.hist(df["precipitation"], bins=5) # 绘制直方图,将降水量均匀分为5组
ax1.set_xlabel("降水量")
ax1.set_ylabel("出现频次")
plt.show()![image-20250629111403515]()
2.12.4 多变量可视化
双变量。使用散点图呈现降水量随最高气温变化的大致趋势。
1
2
3
4
5
6
7
8
9
10
11
12
13
14import pandas as pd
import matplotlib.pyplot as plt
from matplotlib import rcParams
rcParams["font.sans-serif"] = ["SimHei"] # 指定中文字体
rcParams["axes.unicode_minus"] = False # 解决负号显示问题
df = pd.read_csv("data/weather.csv")
fig = plt.figure()
ax1 = fig.add_subplot(1, 1, 1)
ax1.scatter(df["temp_max"], df["precipitation"]) # 绘制散点图,横轴为最高气温,纵轴为降水量
ax1.set_xlabel("最高气温")
ax1.set_ylabel("降水量")
plt.show()![image-20250629111755505]()
多变量。使用散点图呈现降水量随最高气温变化的大致趋势,用不同颜色区分不同年份的数据。
1
2
3
4
5
6
7
8
9
10
11
12
13
14
15
16
17
18
19
20
21
22
23
24
25
26
27
28
29
30import pandas as pd
import matplotlib.pyplot as plt
from matplotlib import rcParams
rcParams["font.sans-serif"] = ["SimHei"] # 指定中文字体
rcParams["axes.unicode_minus"] = False # 解决负号显示问题
def year_color(x):
"""添加一列,为不同年份的数据添加不同的颜色"""
match x.year:
case 2012:
return "r"
case 2013:
return "g"
case 2014:
return "b"
case 2015:
return "k"
df = pd.read_csv("data/weather.csv")
df["date"] = pd.to_datetime(df["date"])
df["color"] = df["date"].apply(year_color)
fig = plt.figure()
ax1 = fig.add_subplot(1, 1, 1)
# 绘制散点图,横轴为最高气温,纵轴为降水量
# c设置颜色,alpha设置透明度
ax1.scatter(df["temp_max"], df["precipitation"], c=df["color"], alpha=0.5)
ax1.set_xlabel("最高气温")
ax1.set_ylabel("降水量")
plt.show()![image-20250629111909171]()
2.13 Pandas可视化
- pandas提供了非常方便的绘图功能,可以直接在DataFrame或Series上调用plot()方法来生成各种类型的图表。底层实现依赖于Matplotlib,pandas的绘图功能集成了许多常见的图形类型,易于使用。
2.13.1 单变量可视化
使用sleep(睡眠健康和生活方式)数据集,其中包含13个字段:
- person_id:每个人的唯一标识符。
- gender:个人的性别(男/女)。
- age:个人的年龄(以岁为单位)。
- occupation:个人的职业或就业状况(例如办公室职员、体力劳动者、学生)。
- sleep_duration:每天的睡眠总小时数。
- sleep_quality:睡眠质量的主观评分,范围从 1(差)到 10(极好)。
- physical_activity_level:每天花费在体力活动上的时间(以分钟为单位)。
- stress_level:压力水平的主观评级,范围从 1(低)到 10(高)。
- bmi_category:个人的 BMI 分类(体重过轻、正常、超重、肥胖)。
- blood_pressure:血压测量,显示为收缩压与舒张压的数值。
- heart_rate:静息心率,以每分钟心跳次数为单位。
- daily_steps:个人每天行走的步数。
- sleep_disorder:存在睡眠障碍(无、失眠、睡眠呼吸暂停)。
加载数据:
1
2
3
4
5
6
7
8
9
10
11
12
13
14
15
16
17
18
19
20
21
22
23import pandas as pd
df = pd.read_csv("data/sleep.csv")
df.info() # 查看数据集信息
# RangeIndex: 400 entries, 0 to 399
# Data columns (total 13 columns):
# # Column Non-Null Count Dtype
# --- ------ -------------- -----
# 0 person_id 400 non-null int64
# 1 gender 400 non-null object
# 2 age 400 non-null int64
# 3 occupation 400 non-null object
# 4 sleep_duration 400 non-null float64
# 5 sleep_quality 400 non-null float64
# 6 physical_activity_level 400 non-null int64
# 7 stress_level 400 non-null int64
# 8 bmi_category 400 non-null object
# 9 blood_pressure 400 non-null object
# 10 heart_rate 400 non-null int64
# 11 daily_steps 400 non-null int64
# 12 sleep_disorder 110 non-null object
# dtypes: float64(2), int64(6), object(5)
# memory usage: 40.8+ KB柱状图:用于展示类别数据的分布情况。它通过一系列矩形的高度(或长度)来展示数据值,适合对比不同类别之间的数量或频率。简单直观,容易理解和比较各类别数据。使用柱状图展示不同睡眠时长的数量。
1
2
3pd.cut(df["sleep_duration"], [0, 5, 6, 7, 8, 9, 10, 11, 12]).value_counts().plot.bar(
color=["red", "green", "blue", "yellow", "cyan", "magenta", "black", "purple"]
)![image-20250629130402226]()
折线图:折线图通常用于展示连续数据的变化趋势。它通过一系列数据点连接成的线段来表示数据的变化。能够清晰地展示数据的趋势和波动。使用折线图展示不同睡眠时长的数量。
1
pd.cut(df["sleep_duration"], [0, 5, 6, 7, 8, 9, 10, 11, 12]).value_counts().sort_index().plot()
![image-20250629130731537]()
面积图:面积图是折线图的一种变体,线下的区域被填充颜色,用于强调数据的总量或变化。可以更直观地展示数据量的变化,适合用来展示多个分类的累计趋势。使用面积图展示不同睡眠时长的数量。
1
pd.cut(df["sleep_duration"], [0, 5, 6, 7, 8, 9, 10, 11, 12]).value_counts().sort_index().plot.area()
![image-20250629130845655]()
直方图:直方图用于展示数据的分布情况。它将数据范围分成多个区间,并通过矩形的高度显示每个区间内数据的频率或数量。可以揭示数据分布的模式,如偏态、峰度等。使用直方图展示不同睡眠时长的数量。
1
df["sleep_duration"].value_counts().plot.hist()
![image-20250629130940646]()
饼状图:饼状图用于展示一个整体中各个部分所占的比例。它通过一个圆形图形分割成不同的扇形,每个扇形的角度与各部分的比例成正比。能够快速展示各部分之间的比例关系,但不适合用于展示过多的类别或比较数值差异较小的部分。使用饼状图展示不同睡眠时长的占比。
1
pd.cut(df["sleep_duration"], [0, 5, 6, 7, 8, 9, 10, 11, 12]).value_counts().sort_index().plot.pie()
![image-20250629131027477]()
2.13.2 双变量可视化
散点图:散点图通过在二维坐标系中绘制数据点来展示两组数值数据之间的关系。能够揭示两个变量之间的相关性和趋势。绘制睡眠时间与睡眠质量的散点图。
1
df.plot.scatter(x="sleep_duration", y="sleep_quality")
![image-20250629131209795]()
蜂窝图:蜂窝图是散点图的扩展,通常用于表示大量数据点之间的关系。它通过将数据点分布在一个六边形网格中,每个六边形的颜色代表其中的数据密度。适合展示大量数据点,避免了散点图中的过度重叠问题。绘制睡眠时间与睡眠质量的蜂窝图。
1
df.plot.hexbin(x="sleep_duration", y="sleep_quality", gridsize=10)
![image-20250629131315259]()
堆叠图:堆叠图用于展示多个数据系列的累积变化。常见的堆叠图包括堆叠柱状图、堆叠面积图等。它通过将每个数据系列堆叠在前一个系列之上,展示数据的累积情况。能够清晰地展示不同部分的相对贡献,适合多个数据系列的比较。绘制睡眠时间与睡眠质量的堆叠图。
1
2
3
4
5
6df["sleep_quality_stage"] = pd.cut(df["sleep_quality"], range(11))
df["sleep_duration_stage"] = pd.cut(df["sleep_duration"], [0, 5, 6, 7, 8, 9, 10, 11, 12])
df_pivot_table = df.pivot_table(
values="person_id", index="sleep_quality_stage", columns="sleep_duration_stage", aggfunc="count"
)
df_pivot_table.plot.bar()![image-20250629131809528]()
设置stacked=True,会将柱体堆叠。
1
df_pivot_table.plot.bar(stacked=True)
![image-20250629131850470]()
折线图:
1
df_pivot_table.plot.line()
![image-20250629132024717]()
2.14 Seaborn可视化
2.14.1 什么是Seaborn
- Seaborn是一个基于Matplotlib的Python可视化库,旨在简化数据可视化的过程。它提供了更高级的接口,用于生成漂亮和复杂的统计图表,同时也能保持与Pandas数据结构的良好兼容性。
2.14.2 单变量可视化
使用penguins(企鹅🐧)数据集,其中包含7个字段:
- species:企鹅种类(Adelie、Gentoo、Chinstrap)。
- island:观测岛屿(Torgersen, Biscoe, Dream)。
- bill_length_mm:喙(嘴)长度(毫米)。
- bill_depth_mm:喙深度(毫米)。
- flipper_length_mm:脚蹼长度(毫米)。
- body_mass_g:体重(克)。
- sex:性别(Male、Female)。
1
2
3
4
5
6
7
8
9
10
11
12
13
14
15
16
17
18
19species,island,bill_length_mm,bill_depth_mm,flipper_length_mm,body_mass_g,sex
Adelie,Torgersen,39.1,18.7,181.0,3750.0,Male
Adelie,Torgersen,39.5,17.4,186.0,3800.0,Female
Adelie,Torgersen,40.3,18.0,195.0,3250.0,Female
Adelie,Torgersen,,,,,
Adelie,Torgersen,36.7,19.3,193.0,3450.0,Female
Adelie,Torgersen,39.3,20.6,190.0,3650.0,Male
Adelie,Torgersen,38.9,17.8,181.0,3625.0,Female
Adelie,Torgersen,39.2,19.6,195.0,4675.0,Male
Adelie,Torgersen,34.1,18.1,193.0,3475.0,
Adelie,Torgersen,42.0,20.2,190.0,4250.0,
Adelie,Torgersen,37.8,17.1,186.0,3300.0,
Adelie,Torgersen,37.8,17.3,180.0,3700.0,
Adelie,Torgersen,41.1,17.6,182.0,3200.0,Female
Adelie,Torgersen,38.6,21.2,191.0,3800.0,Male
Adelie,Torgersen,34.6,21.1,198.0,4400.0,Male
Adelie,Torgersen,36.6,17.8,185.0,3700.0,Female
Adelie,Torgersen,38.7,19.0,195.0,3450.0,Female
Adelie,Torgersen,42.5,20.7,197.0,4500.0,Male加载数据:
1
2
3
4
5
6
7
8
9
10
11
12
13
14
15
16
17
18
19
20
21
22import pandas as pd
import seaborn as sns
import matplotlib.pyplot as plt
plt.rcParams["font.sans-serif"] = ["KaiTi"]
penguins = pd.read_csv("data/penguins.csv")
penguins.dropna(inplace=True)
penguins.info()
# <class 'pandas.core.frame.DataFrame'>
# Index: 333 entries, 0 to 343
# Data columns (total 7 columns):
# # Column Non-Null Count Dtype
# --- ------ -------------- -----
# 0 species 333 non-null object
# 1 island 333 non-null object
# 2 bill_length_mm 333 non-null float64
# 3 bill_depth_mm 333 non-null float64
# 4 flipper_length_mm 333 non-null float64
# 5 body_mass_g 333 non-null float64
# 6 sex 333 non-null object
# dtypes: float64(4), object(3)
# memory usage: 20.8+ KB直方图:绘制不同种类企鹅数量的直方图。
1
sns.histplot(data=penguins, x="species")
![image-20250629132412072]()
核密度估计图:核密度估计图(KDE,Kernel Density Estimate Plot)是一种用于显示数据分布的统计图表,它通过平滑直方图的方法来估计数据的概率密度函数,使得分布图看起来更加连续和平滑。核密度估计是一种非参数方法,用于估计随机变量的概率密度函数。其基本思想是,将每个数据点视为一个“核”(通常是高斯分布),然后将这些核的贡献相加以形成平滑的密度曲线。绘制喙长度的核密度估计图。
1
sns.kdeplot(data=penguins, x="bill_length_mm")
![image-20250629132451942]()
在histplot()中设置kde=True也可以得到核密度估计图。
1
sns.histplot(data=penguins, x="bill_length_mm", kde=True)
![image-20250629132530400]()
计数图:计数图用于绘制分类变量的计数分布图,显示每个类别在数据集中出现的次数,是分析分类数据非常直观的工具,可以快速了解类别的分布情况。绘制不同岛屿企鹅数量的计数图。
1
sns.countplot(data=penguins, x="island")
![image-20250629132609301]()
2.14.3 双变量可视化
散点图:绘制横轴为体重,纵轴为脚蹼长度的散点图。可通过hue参数设置不同组别进行对比。
1
sns.scatterplot(data=penguins, x="body_mass_g", y="flipper_length_mm", hue="sex")
![image-20250629132737080]()
也可以通过regplot()函数绘制散点图,同时会拟合回归曲线。可以通过fit_reg=False关闭拟合。
1
sns.regplot(data=penguins, x="body_mass_g", y="flipper_length_mm")
![image-20250629132808851]()
也可以通过lmplot()函数绘制基于hue参数的分组回归图。
1
sns.lmplot(data=penguins, x="body_mass_g", y="flipper_length_mm", hue="sex")
![image-20250629132838009]()
也可以通过jointplot()函数绘制在每个轴上包含单个变量的散点图。
1
sns.jointplot(data=penguins, x="body_mass_g", y="flipper_length_mm")
![image-20250629132948734]()
蜂窝图:通过jointplot()函数,设置kind=”hex”来绘制蜂窝图。
1
sns.jointplot(data=penguins, x="body_mass_g", y="flipper_length_mm", kind="hex")
![image-20250629133023357]()
二维核密度估计图:通过kdeplot()函数,同时设置x参数和y参数来绘制二维核密度估计图。
1
sns.kdeplot(data=penguins, x="body_mass_g", y="flipper_length_mm")
![image-20250629133057649]()
通过fill=True设置为填充,通过cbar=True设置显示颜色示意条。
1
sns.kdeplot(data=penguins, x="body_mass_g", y="flipper_length_mm", fill=True, cbar=True)
![image-20250629133120576]()
条形图:条形图会按x分组对y进行聚合,通过estimator参数设置聚合函数,并通过errorbar设置误差条,误差条默认会显示。可以通过误差条显示抽样数据统计结果的可能统计范围,如果数据不是抽样数据, 可以设置为None来关闭误差条。
1
sns.barplot(data=penguins, x="species", y="bill_length_mm", estimator="mean", errorbar=None)
![image-20250629133155179]()
箱线图:
- 箱线图是一种用于展示数据分布、集中趋势、散布情况以及异常值的统计图表。它通过五个关键的统计量(最小值、第一四分位数、中位数、第三四分位数、最大值)来展示数据的分布情况。
- 箱线图通过箱体和须来表现数据的分布,能够有效地显示数据的偏斜、分散性以及异常值。箱线图的组成部分:
- 箱体(Box):
- 下四分位数(Q1):数据集下 25% 的位置,箱体的下边缘。
- 上四分位数(Q3):数据集下 75% 的位置,箱体的上边缘。
- 四分位间距(IQR, Interquartile Range):Q3 和 Q1 之间的距离,用来衡量数据的离散程度。
- 中位数(Median):箱体内部的水平线,表示数据集的中位数。
- 须(Whiskers):
- 下须:从 Q1 向下延伸,通常是数据集中最小值与 Q1 的距离,直到没有超过1.5倍 IQR 的数据点为止。
- 上须:从 Q3 向上延伸,通常是数据集中最大值与 Q3 的距离,直到没有超过1.5倍 IQR 的数据点为止。
- 异常值(Outliers):
- 超过1.5倍 IQR 的数据被认为是异常值,通常用点标记出来。异常值是数据中相对于其他数据点而言“非常大”或“非常小”的值。
- 箱体(Box):
1
sns.boxplot(data=penguins, x="species", y="bill_length_mm")
![image-20250629133347963]()
小提琴图:小提琴图(Violin Plot) 是一种结合了箱线图和核密度估计图(KDE)的可视化图表,用于展示数据的分布情况、集中趋势、散布情况以及异常值。小提琴图不仅可以显示数据的基本统计量(如中位数和四分位数),还可以展示数据的概率密度,提供比箱线图更丰富的信息。
1
sns.violinplot(data=penguins, x="species", y="bill_length_mm")
![image-20250629133422371]()
成对关系图:
- 成对关系图是一种用于显示多个变量之间关系的可视化工具。它可以展示各个变量之间的成对关系,并且通过不同的图表形式帮助我们理解数据中各个变量之间的相互作用。
- 对角线上的图通常显示每个变量的分布(如直方图或核密度估计图),帮助观察每个变量的单变量特性。其他位置展示所有变量的两两关系,用散点图表示。
1
sns.pairplot(data=penguins, hue="species")
![image-20250629133506050]()
通常情况下成对关系图左上和右下对应位置的图的信息是相同的,可以通过PairGrid()为每个区域设置不同的图类型。
1
2
3
4
5
6pair_grid = sns.PairGrid(data=penguins, hue="species")
# 通过 map 方法在网格上绘制不同的图形
pair_grid.map_upper(sns.scatterplot) # 上三角部分使用散点图
pair_grid.map_lower(sns.kdeplot) # 下三角部分使用核密度估计图
pair_grid.map_diag(sns.histplot) # 对角线部分使用直方图![image-20250629133535292]()
2.14.4 多变量可视化
多数绘图函数都支持使用hue参数设置一个类别变量,统计时按此类别分组统计并在绘图时使用颜色区分。例如对小提琴图设置hue参数添加性别类别:
1
sns.violinplot(data=penguins, x="species", y="bill_length_mm", hue="sex", split=True)
![image-20250629133612051]()
2.14.5 Seaborn样式
在Seaborn中,样式(style)控制了图表的整体外观,包括背景色、网格线、刻度线等元素。Seaborn提供了一些内置的样式选项,可以通过seaborn.set_style()来设置当前图表的样式。常见的样式有以下几种:
- white:纯白背景,没有网格线。
- dark:深色背景,带有网格线。
- whitegrid:白色背景,带有网格线。
- darkgrid:深色背景,带有网格线(默认样式)。
1
2sns.set_style("darkgrid")
sns.histplot(data=penguins, x="island", kde=True)![image-20250629133712906]()
